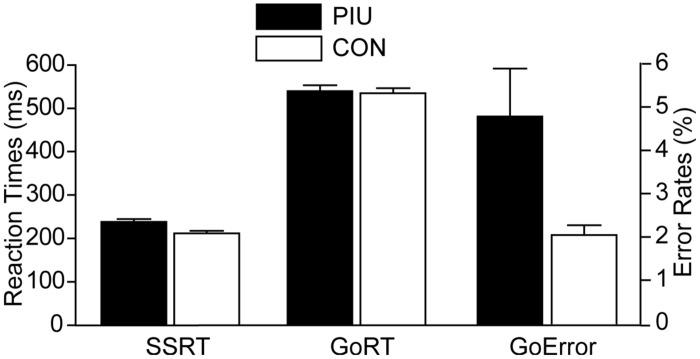
FIGURE 2.
Stop signal task performance group means and 95% confidence intervals for three measures: stop signal reaction time (SSRT; an index of response inhibition), reaction time in go trials (GoRT), and error rates in go trials (GoError). SSRTs and RTs were in ms (left y-axis), whereas error rates were in percentages (right y-axis). PIU individuals had significantly longer SSRTs and higher error rates than the control group, but they did not significantly differ in RTs measures.

