
Figure 7.
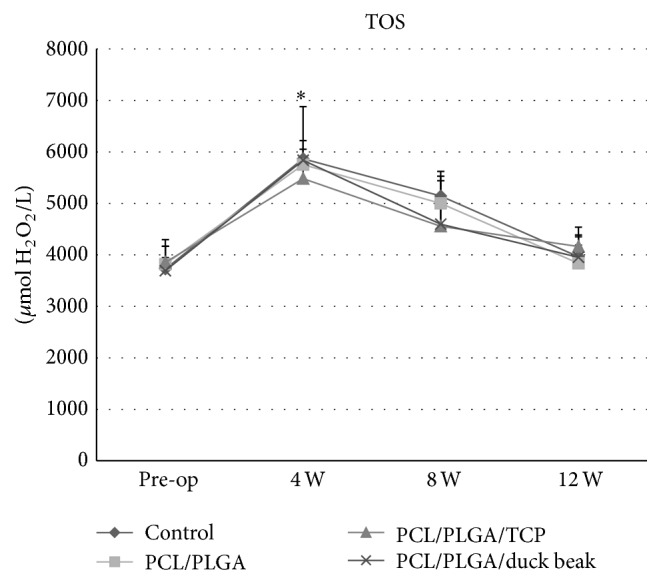
Changes in oxidative stress markers after implantation. The mean serum total oxidant status (TOS) followed the similar pattern in control group and scaffold groups. The values are the mean ± SD (n = 4). ∗Significantly different (P < 0.05) from baseline.