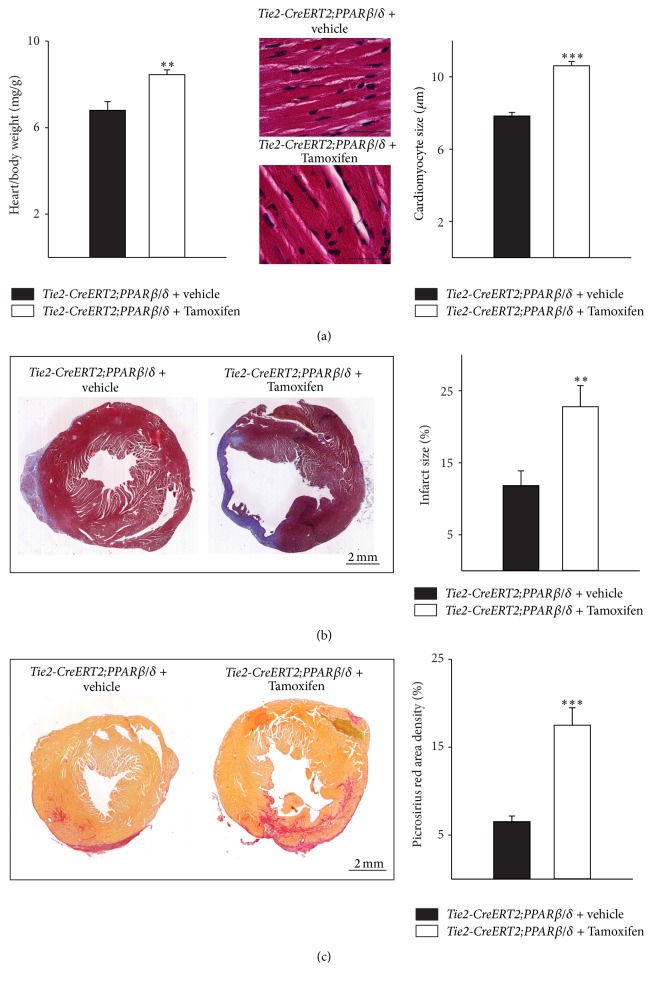
Figure 5.
Increased infarct sizes and higher cardiac fibrosis in animals with vascular-specific PPARβ/δ overexpression. (a) Respective heart-to-body weight ratios and high power photomicrographs of HE-stained heart sections showing individual cardiomyocytes and quantification of cardiomyocyte diameters. Scale bars indicate 50 μm. (b) Photomicrographs of Trichrome Masson stained cross sections and quantification of the infarct sizes (Tie2-CreERT2;PPARβ/δ + Tamoxifen, n = 8, and Tie2-CreERT2;PPARβ/δ + vehicle, n = 5). Scale bars indicate 2 mm. (c) Photomicrographs of Picrosirius red stained cross sections and quantification of cardiac fibrosis. Scale bars indicate 2 mm. Data are means ± SEM. ∗∗ p < 0.01 and ∗∗∗ p < 0.001.

