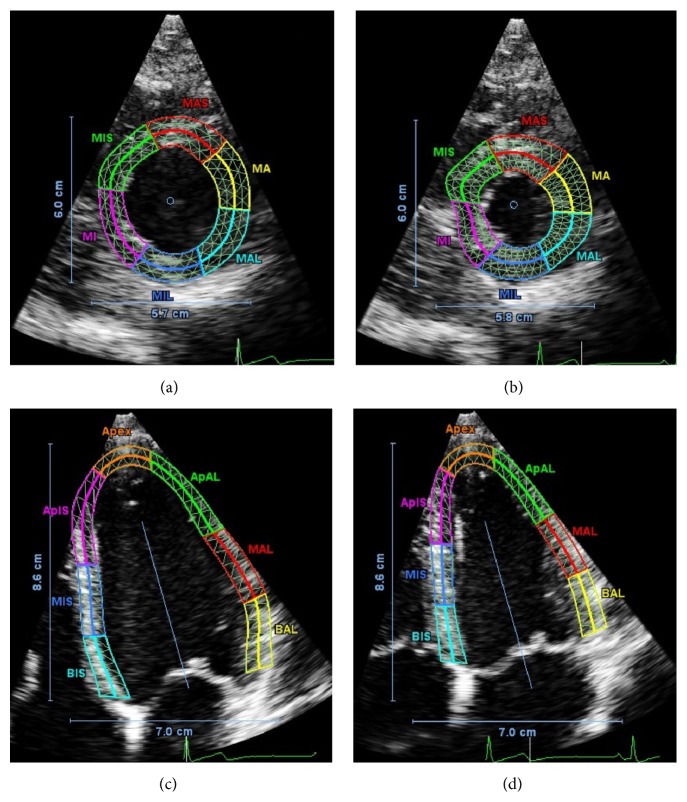
Figure 3.
Example images (short axis (a, b) and long axis (c, d)) from echocardiography of a single control patient. SA images are at the midlevel plane, as viewed from the apex of the heart. LA images are in the four-chamber plane (AP4). The colored overlays indicate the myocardial regions considered in the estimation of regional LV strain and rotation as defined in Figure 1. The labels on each region indicate the subdivision in both longitudinal and circumferential directions. Preceding a region, “A” represents apex, “M” represents mid, and “B” represents base. For example, “MAL” represents mid plane, anterior lateral region. Each region is further subdivided into the epicardial and endocardial regions by the bold solid line in the center of each colored region.

