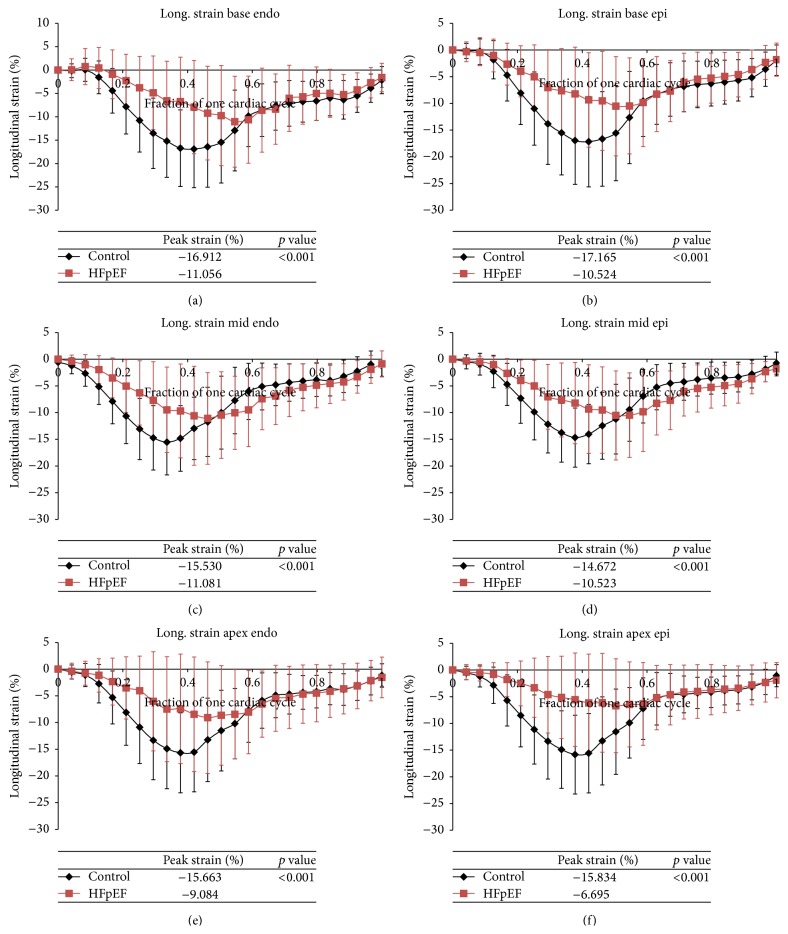
Figure 4.
(a)–(f) Average longitudinal strain over one cardiac cycle for control patients (black) versus HFpEF patients (red). Strains at each of the regions of the heart both endocardium (endo) and epicardium (epi) are displayed: base endo, epi (a, b), mid endo, epi (c, d), and apex endo, epi (e, f).

