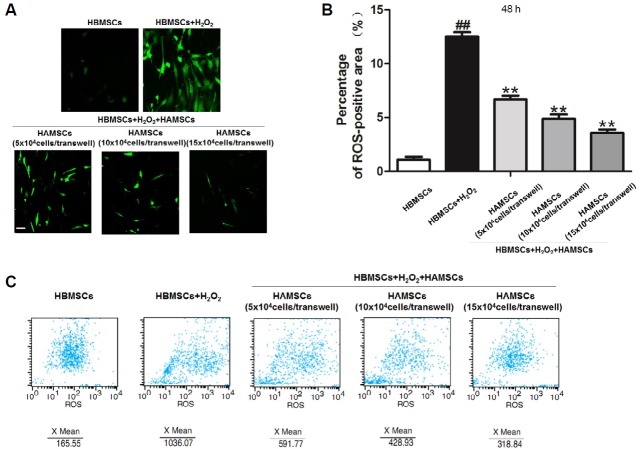
Fig. 2.
Flow cytometry and immunofluorescence staining of ROS generation in H2O2-induced HBMSCs after co-culturing with or without HAMSCs (A) Macrographs of DCFDA fluorescence were detected by fluorescence microscopy at 48 h. (B) The area of stained ROS-positive nodules relative to the total culture surface at 48 h was measured by Image-pro Plus analysis (IPP). (C) The intensity of fluorescence was determined by flow cytometry at 48 h. Scale bar, 100 μm; ##P < 0.01 vs. the HBMSCs group; *P < 0.05 and **P < 0.01 compared with the group treated with H2O2 alone.

