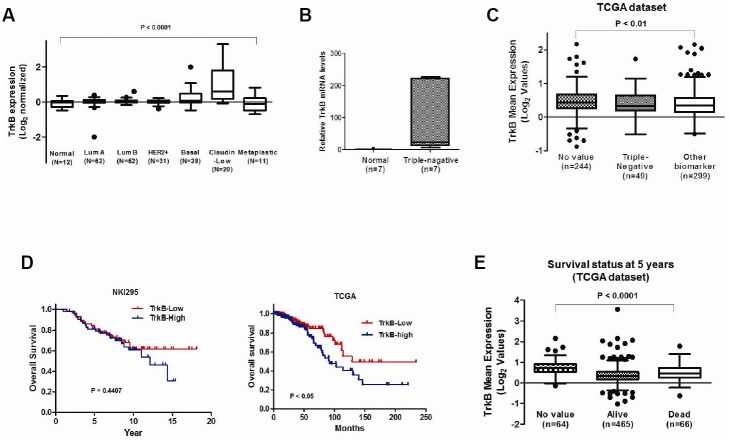
Fig. 2.
Expression of TrkB correlates with pathological phenotypes of breast tissues. (A) The gene expression data were plotted as Box-and-whisker (Tukey) plots of mean TrkB expression levels in breast cancer patients. The TrkB level was extracted from the dataset and averaged for each tumor. Points below and above the whiskers are drawn as individual dots. A P < 0.0001 was considered to be significant in ANOVA. (B) The relative expression of the TrkB mRNA in normal or triple-negative breast carcinoma samples as determined by quantitative RT-PCR. Normalization was done using 18S mRNA levels. (C) The mean TrkB expression in other subtypes or triple-negative subtypes of human breast cancer patients. The TrkB gene expression level was extracted from the dataset and averaged for each tumor. Points below and above the whiskers are drawn as individual dots. A P < 0.0001 was considered statistically significant in ANOVA. (D) Patients were divided into those who expressed high and low TrkB levels, and their survival rates from two publicly available data sets (NKI295 and TCGA dataset) were compared. The P value was calculated by a log-rank test. (E) The mean TrkB expression in surviving or deceased breast cancer patients. The TrkB gene expression level was extracted from the dataset and averaged for each tumor. Points below and above the whiskers are drawn as individual dots. A P < 0.0001 was considered significant in ANOVA.

