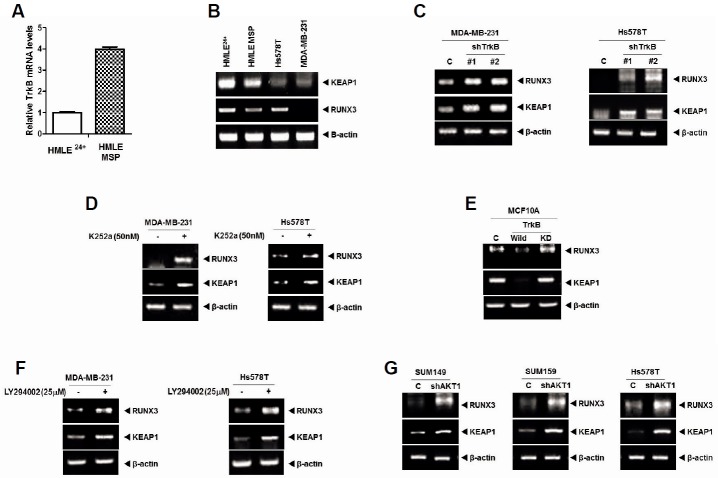
Fig. 3.
TrkB represses Runx3 and Keap1 expression through AKT activation. (A) The relative expression of mRNA encoding TrkB in HMLE24+ and HMLE MSP cells as determined by quantitative RT-PCR. Normalization was done using 18S mRNA expression levels. (B) RT-PCR analysis of Keap1 and Runx3 expression in HMLE24+, HMLE MSP, Hs578T, and MDA-MB-231 cells. β-actin was used as a loading control. (C) RT-PCR analysis of Keap1 and Runx3 expression in MDA-MB-231 and Hs578T control-shRNA or TrkB-shRNA cells. The β-actin was used as a loading control. (D) RT-PCR analysis of Keap1 and Runx3 expression in MDA-MB-231 and Hs578T with or without K252a (50 nM) treatment. The β-actin was used as a loading control. (E) RT-PCR analysis of Keap1 and Runx3 expression in MCF10A, MCF10A-TrkB, and MCF10A-TrkB kinase dead (K571N) cells. The β-actin was used as a loading control. (F) RT-PCR analysis of Keap1 and Runx3 expression in MDA-MB-231 and Hs578T with or without LY294002 (PI3K inhibitor) treatment. The β-actin was used as a loading control. (G) RT-PCR analysis of Keap1 and Runx3 expression in SUM149, SUM159, and Hs578T control-shRNA or AKT1-shRNA cells. β-actin was used as a loading control.

