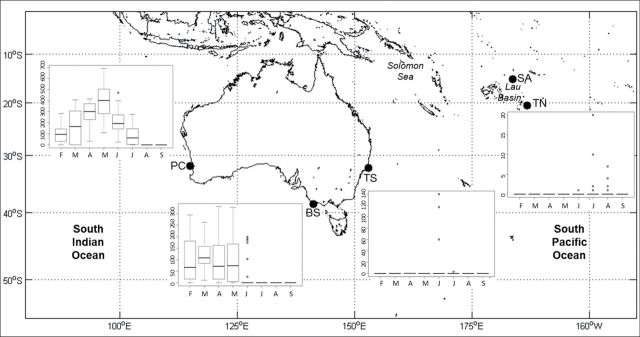
Fig. 2.
Box plots represent the median (with 0.25 and 0.75 quantile) number of calls detected per month (February to September) for AUSB at the PC = Perth Canyon and BS = Bass Strait and NZB at the TS = Tasman Sea and TN = Tonga. No AUSB or NZB whale calls were detected off SA = Samoa. Bars indicate maximum and minimum values and outliers are plotted as individual points.

