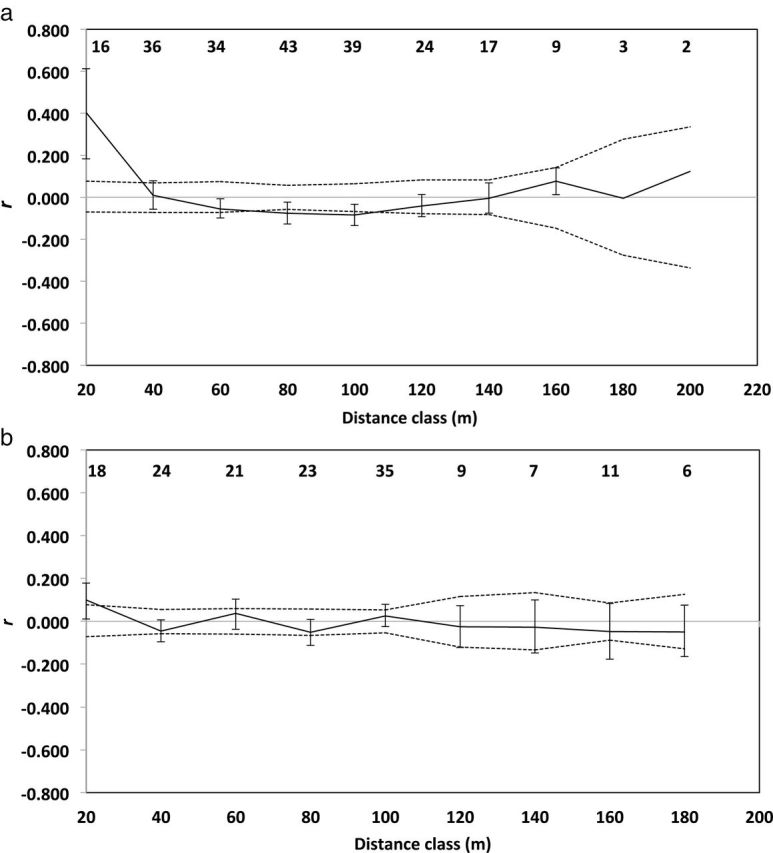
Fig. 2.

Correlograms illustrating the genetic correlation coefficient (r) as a function of geographical distance for resident adult a) female and b) male prairie voles (Microtus ochrogaster) in Kansas. Upper and lower permuted 95% CI (dashed lines) about the null hypothesis of no genetic structure (r = 0), and bootstrapped 95% CI error bars about r are shown. Sample sizes for each distance category are indicated at top of correlograms.
