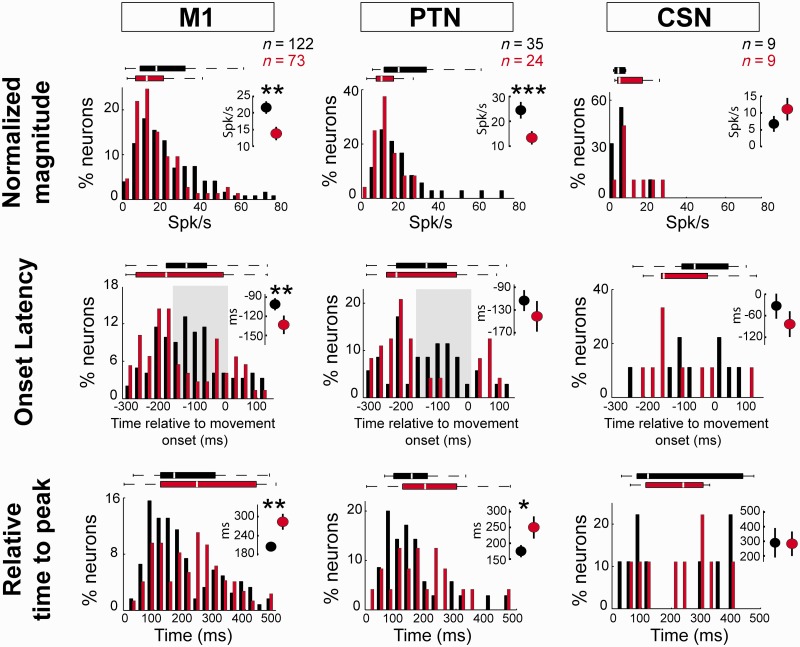
Figure 7.
MPTP effects on kinematic-independent (‘residual’) increases in firing. The distributions of response magnitude (top), onset latency (middle) and relative time to peak (bottom) are plotted for increase-type response residuals sampled before (black) and after (red) MPTP administration. Inset plots show the means (± SEM) and significance of each pre- versus post-MPTP comparison (*P < 0.05, **P < 0.01, ***P < 0.001, Mann-Whitney U-test). Horizontal box plots show the middle two quartiles of the distributions. The central white line within each box corresponds to the median value and horizontal ‘whiskers’ outside each box show the extent of the overall distribution (excluding outliers). n-values indicate the numbers of neurons included in each comparison as determined by presence of a significant increase in peri-movement residual activity (P < 0.002, t-test). Results are shown separately for all M1 neurons, PTNs, and CSNs. Grey shaded boxes in the onset latency plots indicate the 150-ms time window immediately preceding movement onset during which few response onsets were found in the post-MPTP neuronal populations.

