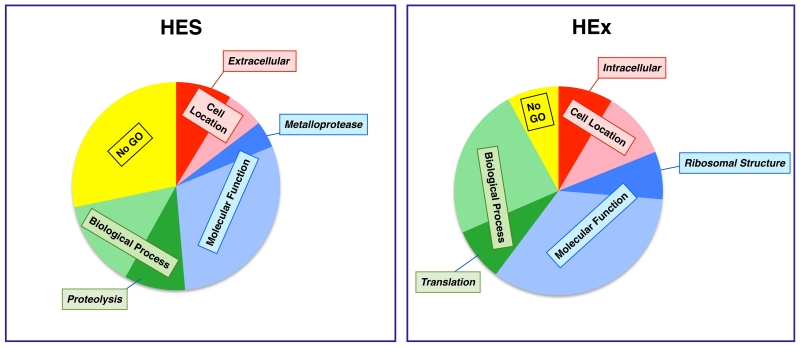
Figure 2. GO distribution of the proteins in HES and HEx.
All identified proteins in HES and HEx were analysed by Gene Ontology and categorised firstly into 4 broad categories: cell localation (Red), molecular function (Blue), biological process (Green), and no recognized GO similarity (Yellow). Within each category, the most frequent term is shown (darker colours). Some proteins are included in more than one category. A more detailed listing of GO identifications is given in Supplementary Table 3

