Fig 1.
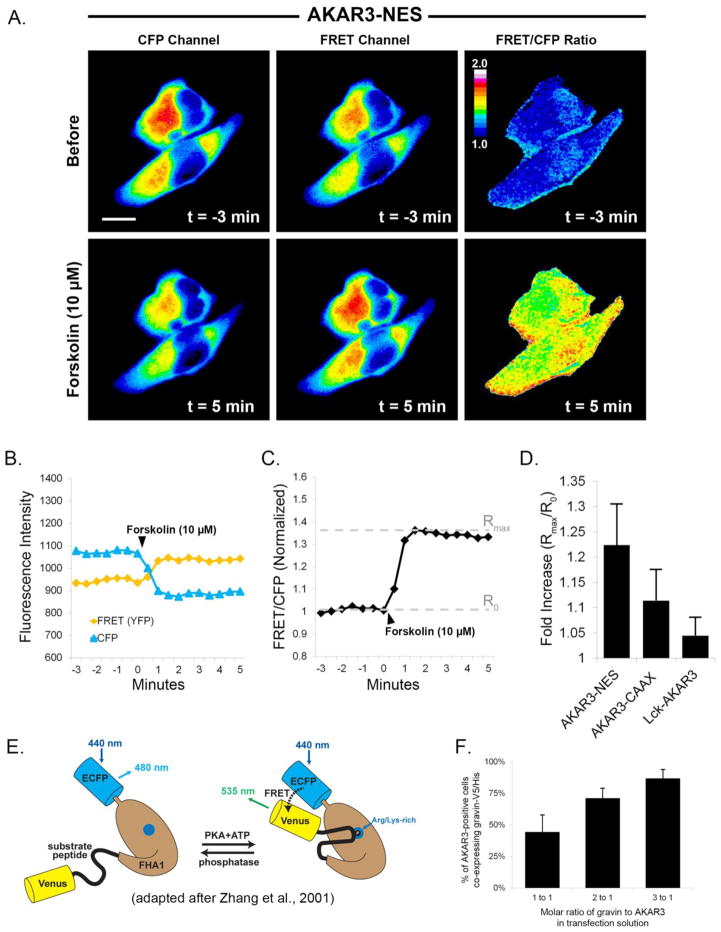
Quantification of PKA dynamics using AKAR3. Images in part A show that upon treatment with forskolin (10 μM), fluorescence in the CFP channel decreased while fluorescence in the FRET channel increased. The ratiometric image shows the consequent increase in FRET/CFP emissions after treatment with forskolin. Graph B shows the quantification of CFP and FRET emissions over time. FRET intensity was corrected for CFP crossover (44%) at each time point. In graph C, the normalized ratio of FRET/CFP intensity was plotted over time, and the fold increase was calculated by dividing the maximal ratio value after treatment (Rmax) by the mean ratio value prior to treatment (R0). Graph D represents the mean fold increase in each of the AKAR3 constructs after forskolin treatment. Scale bar = 10 μm; Cells were incubated in SES with 10 μM IBMX for 30 minutes prior to forskolin treatment. The diagram in E [adapted from ref. 54] illustrates the principle underlying how the FRET biosensor works. PKA dependent phosphorylation of the substrate peptide results in binding of the peptide to a phosphoamino acid binding site on the FHA1 region of the biosenor and a change in the positioning of the fluorescent proteins relative to each other. Graph F illustrates the effect of different molar ratios of AKAR3:gravin plasmid DNA in the transfection mixture on the percentatge coexpression of the gravin construct in cells expressing AKAR3.

