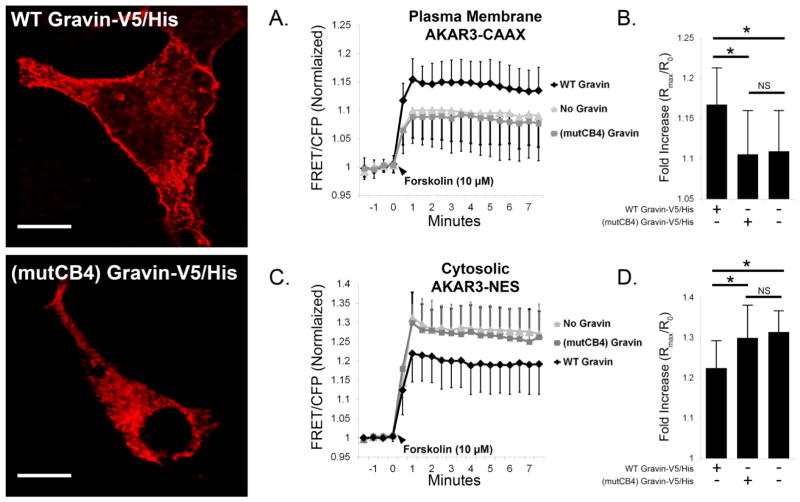
Fig. 6.
Forskolin-stimulated PKA activity at the plasma membrane (AKAR3-CAAX) and cytosol (AKAR3-NES) in AN3 CA cells co-expressing AKAR3 and either WT or (mutCB4) gravin. Representative confocal micrographs show the distribution of transfected gravin-V5/His constructs in fixed cells immunolabeled with a gravin antibody. Graphs A,B show that gravin expression increased forskolin-stimulated PKA activity levels at the plasma membrane compared with control cells lacking gravin, but this increase was not observed in cells expressing mutCB4 gravin. Graphs C,D show that forskolin-stimulated PKA activity levels in the cytosol were reduced in cells expressing WT gravin-V5/His compared with control cells lacking gravin, but this was not observed in cells expressing mutCB4 gravin. One-way ANOVA with Holm-Sidak post hoc tests revealed significant differences between treatments as indicated by asterisks. Error bars denote SD. Scale bar = 10 μm.

