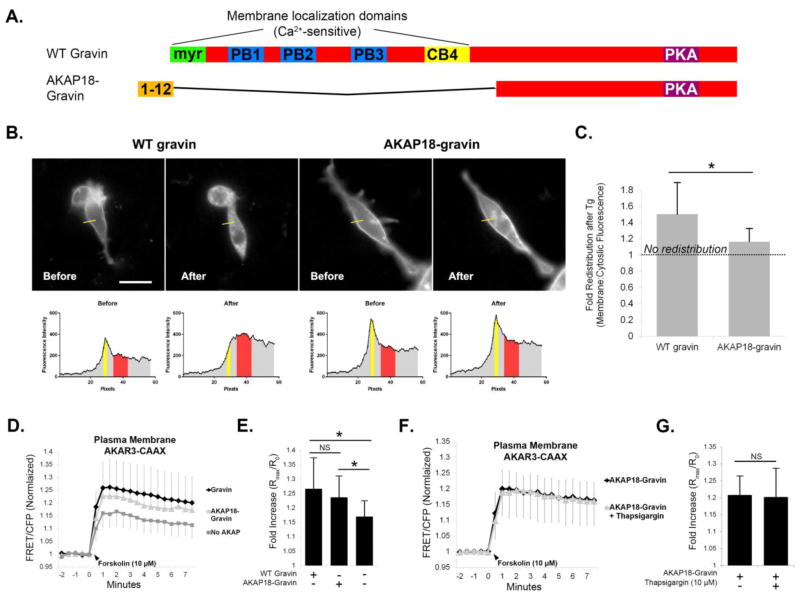
Fig. 8.
Ca2+/PKA crosstalk does not occur in the presence of a Ca2+-resistant gravin mutant. Cartoons depict the AKAP18α-gravin chimera, which replaces gravin’s membrane localization domains with the first twelve amino acids of AKAP18α. Images and corresponding linescans of AN3 CA cells before and after thapsigargin treatment show that while WT gravin undergoes redistribution, the AKAP18-gravin chimera does not. Graph C shows the quantification of the fold change in membrane:cytosolic fluoresence intensity before and after thapsigargin treatment as depicted in the corresponding linescans. Note that a value of 1.0 depicts no redistribution after thapsigargin treatment, and values higher than 1.0 depict a greater extent of redistribution. Graphs D–E show that both WT gravin and AKAP18-gravin caused elevated PKA activity levels at the plasma membrane compared with controls lacking gravin. Graphs F–G show that thapsigargin had no effect on PKA activity levels at the plasma membrane in cells expressing AKAP18-gravin. Statistical differences were determined by a T-test in C, G or one-way ANOVA with Holm-Sidak post hoc in E and are indicated by asterisks. Error bars denote SD. Scale bar = 20 μm.

