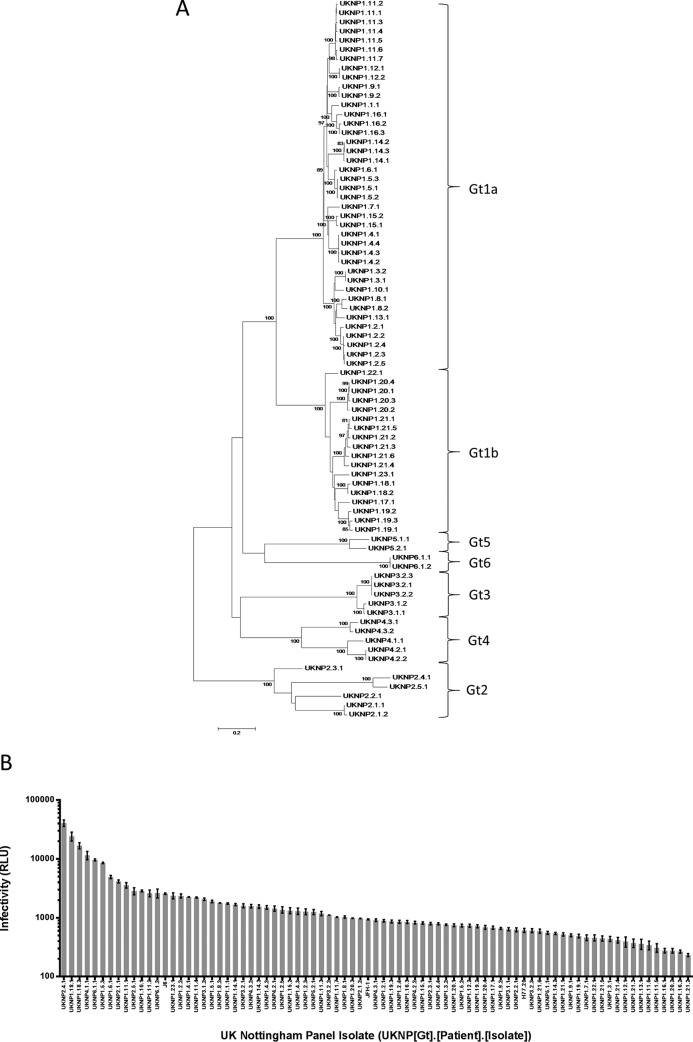
FIG 1.
E1E2 glycoprotein clones, representing the major HCV genotypes, show varying degrees of infectivity. Shown are maximum-likelihood phylogenetic analysis (A) and relative infectivity (B) of the 81 E1E2 clones used for the antibody neutralization panel. (A) The genetic distance for each of the branch lengths shown in the phylogenetic tree is indicated by the scale bar, and the level of bootstrap support (for those branches supported by >95% of replicates) is indicated above each branch. (B) HCVpp generated without a glycoprotein envelope reproducibly gave RLU values of less than 20, and therefore, a cutoff 200 was used to determine if the clone was infectious; only those clones defined as infectious are shown. The data are mean values of triplicates ± standard deviations (SD). UKNP, United Kingdom Nottingham Panel, followed by the genotype, patient number, and isolate number.

