FIG 9.
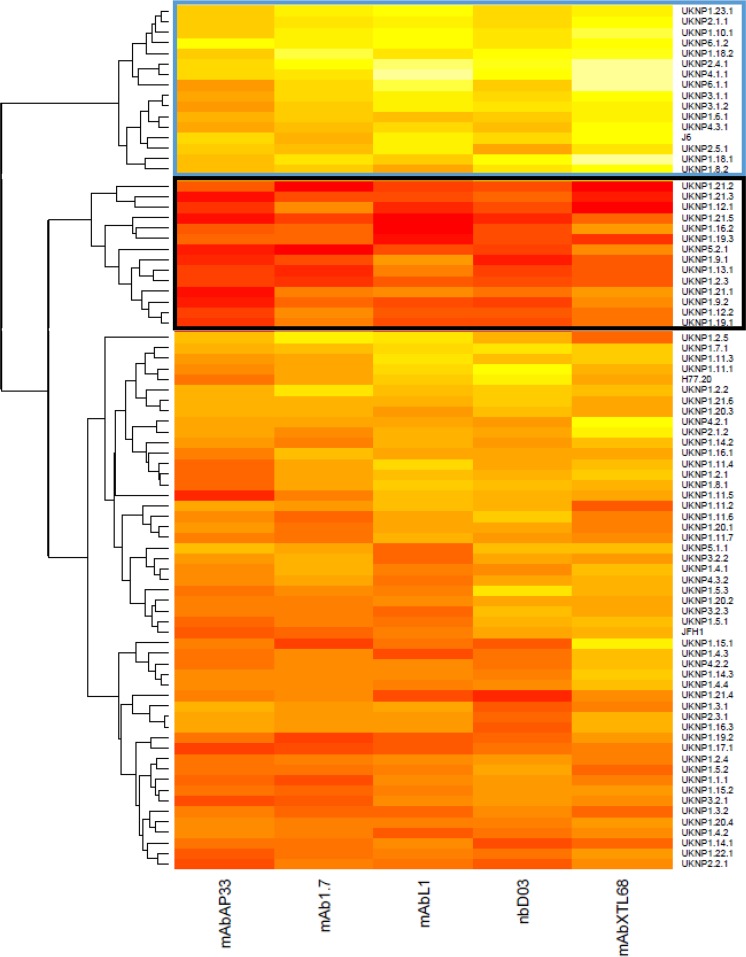
In hierarchical cluster analysis, the E1E2 clones can be grouped according to their sensitivity to monoclonal antibody neutralization. HCV E1E2 pseudoviruses (n = 81) were assessed for neutralization sensitivities using five MAbs targeting discrete epitopes of the CD81 binding site. Individual clones are listed on the right, and antibodies are indicated at the base of the heat map. The magnitude of neutralization (log10 IC50 titer) is denoted by the color, where higher values of neutralization are represented by lighter colors (e.g., light yellows) and lower values are represented by more saturated, dark colors (e.g., dark red). Boxes are drawn around viral isolates that were resistant (blue) and sensitive (black) to neutralization that grouped with >90% probability according to bootstrap resampling (10,000 replicates) of the data set.

