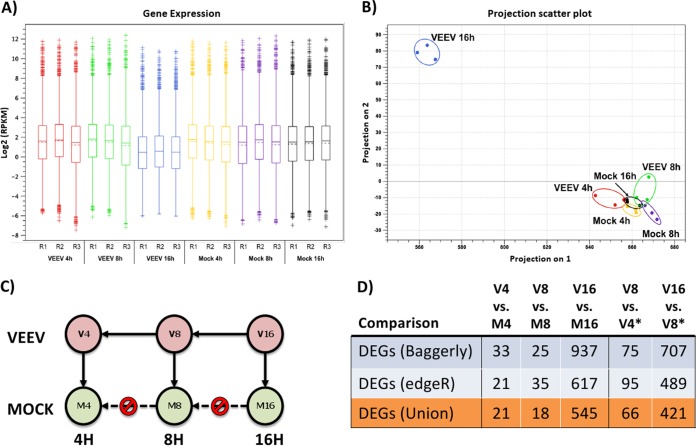
FIG 2.
RNA-Seq data analysis. (A) Box plot of log2-transformed RPKM expression values from each individual biological replicate. (B) Principal component analysis of mock-infected versus VEEV-infected U87MG cells at 4, 8, and 16 hpi. (C) Diagram of the process used for the comparative analysis approach to identify DEGs at each sampling time point. (D) Total number of DEGs identified for each comparison shown in panel C using two different statistical methods (see Materials and Methods). The union of DEGs identified by both methods is shown in orange. *, the comparison includes those genes in VEEV-infected cells whose expression also did not change significantly in mock-infected cells at the same time points. V4, V8, and V16, VEEV-infected cells at 4, 8, and 16 hpi, respectively; M4, M8, and M16, mock-infected cells at 4, 8, and 16 hpi, respectively.

