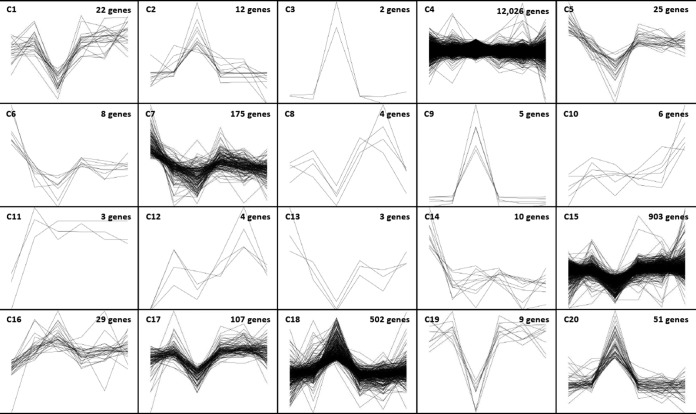
FIG 3.
k-means clustering of expressed genes. k-means clustering (20 groups) of genes based on Euclidean distance metrics of expression over time for both mock- and VEEV-infected U87MG cells. Data were normalized on the basis of the group means and are plotted as the relative transformed expression level for each gene. Each cluster (C) has six data points per gene (VEEV-infected cells at 4, 8, and 16 hpi followed by mock-infected cells at 4, 8, and 16 hpi). See Data Set S2 in the supplemental material for a complete list of genes expressed within each cluster.

