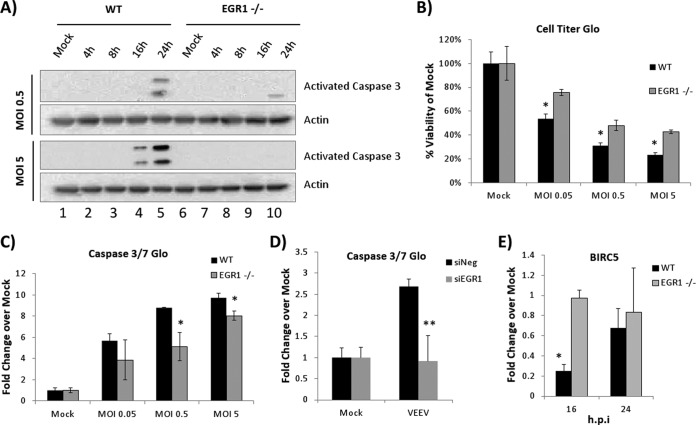
FIG 8.
The loss of EGR1 reduces VEEV-induced apoptosis. (A) EGR1−/− and WT MEFs were infected with VEEV at an MOI of 0.5 or 5. Protein lysates were prepared at 4, 8, 16, and 24 hpi and separated by SDS-PAGE, and Western blot analysis was performed using antibodies against cleaved caspase 3 and actin. Mock-infected cells were included as a control. Results are representative of those from two independent experiments. (B) EGR1−/− and WT MEFs were infected with VEEV at an MOI of 0.05, 0.5, or 5. At 24 hpi cells were analyzed for viability using the CellTiter Glo assay (Promega). Mock-infected cells were included as a control, and their viability was set to 100%. *, P < 0.05 (comparison of WT and EGR1−/− cells at the same MOI). Results are representative of those from two independent experiments. (C) EGR1−/− and WT MEFs were infected with VEEV at an MOI of 0.05, 0.5, or 5. At 24 hpi caspase 3/7 activity was analyzed using the Caspase 3/7 Glo assay (Promega). Mock-infected cells were included as a control, and the fold change value for mock-infected cells was set to a value of 1. *, P < 0.05 (comparison of WT and EGR1−/− cells at the same MOI). Results are representative of those from two independent experiments. (D) U87MG cells were transfected with either a negative-control siRNA (siNeg) or siRNA targeting EGR1 (siEGR1). At 48 h posttransfection, cells were infected with VEEV (MOI, 5). At 24 hpi caspase 3/7 activity was analyzed using the Caspase 3/7 Glo assay. The fold change values for mock-infected cells were set to a value of 1. **, P < 0.001. (E) EGR1−/− and WT MEFs were mock or VEEV infected (MOI, 5). RNA was prepared, and gene expression was determined by qRT-PCR using a TaqMan assays for BIRC5 (survivin). The data shown are the values of the fold change of normalized gene expression determined by the ΔΔCT threshold cycle (CT) method. *, P < 0.005 (comparison of VEEV-infected WT and EGR1−/− cells).

