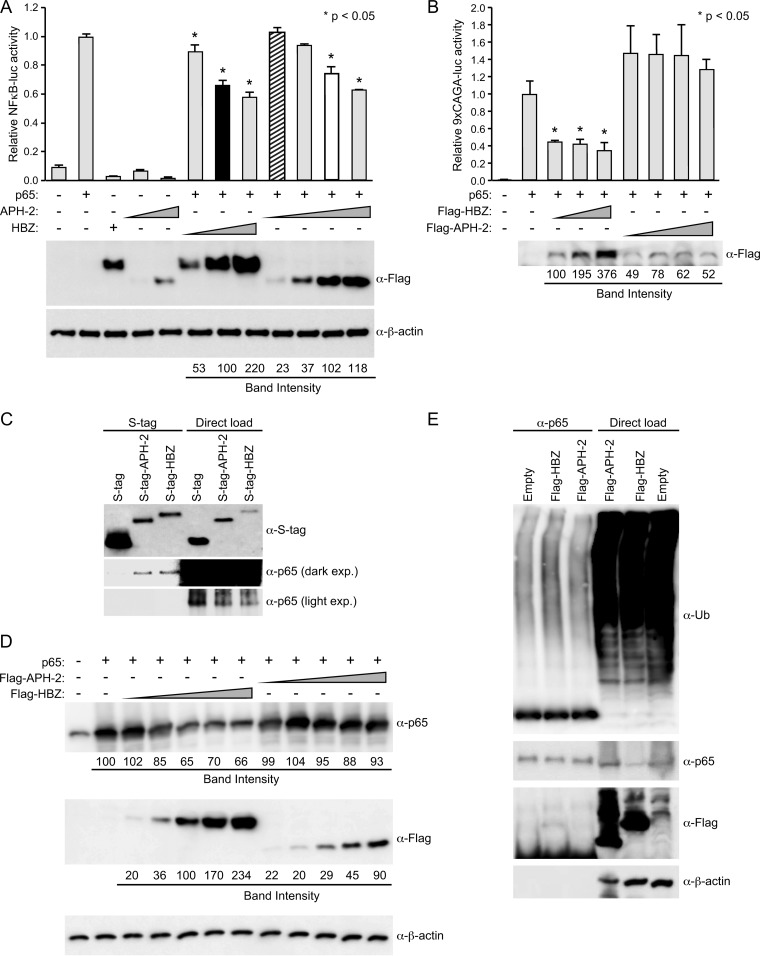
FIG 3.
HBZ and APH-2 repressed p65 transactivation. (A) HEK293T cells were transfected with 20 ng TK-renilla control, 200 ng κB-luciferase reporter, 50 ng p65 expression plasmid, and titrating amounts of FLAG-HBZ, FLAG–APH-2, or the control expression vector, as indicated. (Top) At 24 h posttransfection, cell lysates were collected and luciferase levels were measured; for each condition, relative luciferase activity is shown as the mean fold change from the luciferase activity obtained with p65 expression, which was set at 1. Diagonal striped bar, equivalent FLAG-tagged APH-2 and HBZ (black bar) transfected DNA levels; white bar, similar levels of protein expression. A generalized linear model was used to study the differences between treatments versus p65 expression. Dunnett's method was used to control type I error. *, a statistically significant P value of <0.05 compared to the result for p65 expression. (Bottom) Immunoblot analysis was performed to detect the expression levels (FLAG) of HBZ and APH-2 under each condition relative to that obtained with the loading control, β-actin. (B) Jurkat cells were transfected with 200 ng TK-renilla, 500 ng κB-luciferase reporter, 500 ng p65 expression plasmid, and titrating amounts of FLAG-HBZ, FLAG–APH-2, or the control expression vector, as indicated. At 48 h posttransfection, cells were collected by centrifugation and washed in PBS. A portion of the cells (1/10) was used to measure luciferase levels; relative luciferase activity for each condition is shown as the mean fold change from the luciferase activity obtained with p65 expression, which was set at 1. The remainder of the cells was lysed using NP-40 lysis buffer and subjected to FLAG immunoprecipitation as described in Materials and Methods. The amounts of the immunoprecipitated proteins were then measured by immunoblot analysis (with FLAG antibody). (C) HEK293T cells were cotransfected with p65 and the empty, S-tagged APH-2, or S-tagged HBZ vector. Tagged proteins were purified by S-tag-affinity purification 48 h after transfection. Pulldowns were examined by immunoblot analysis using anti-S-tag and anti-p65 antibodies, as indicated. Five percent of the direct load was used for immunoblot analysis. exp., exposure. (D) HEK293T cells were cotransfected with p65 and titrating amounts of FLAG-HBZ, FLAG–APH-2, or the control expression vector, as indicated. Immunoblot analysis was performed 48 h after transfection to compare the levels of transfected FLAG-tagged HBZ, FLAG-tagged APH-2, and p65. β-Actin expression was used as a loading control. The amount of FLAG-tagged HBZ or APH-2, as well as p65, under each condition relative to the amount of β-actin was measured. (E) HEK293T cells were cotransfected with p65 and FLAG-HBZ, FLAG–APH-2, or the control expression vector, as indicated. At 24 h after transfection, the cells were treated with 10 μM MG132. Coimmunoprecipitation was performed 24 h after MG132 treatment, as described in Materials and Methods. Immunoprecipitated proteins were examined by immunoblot analysis using anti-ubiquitin (α-Ub), anti-p65, and anti-FLAG antibodies, as indicated. Five percent of the direct load was used for immunoblot analysis.

