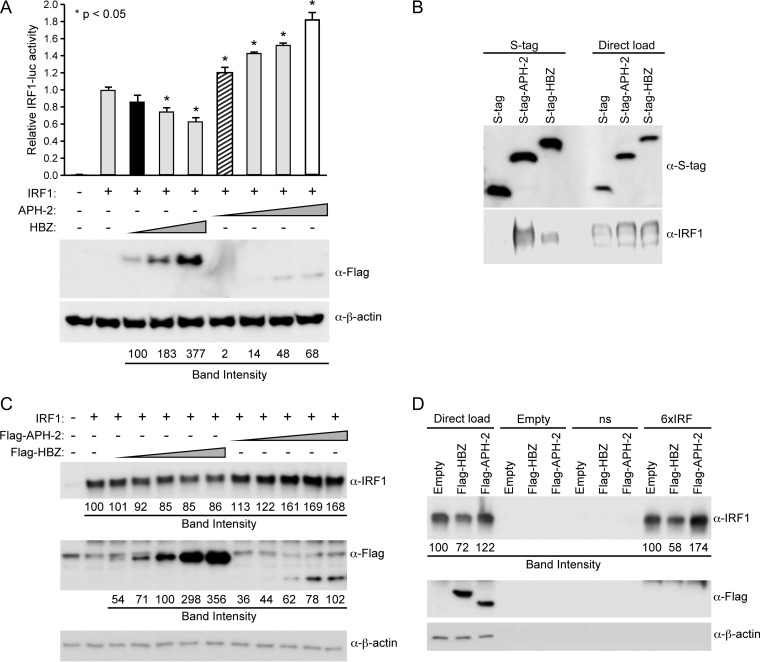
FIG 4.
HBZ, but not APH-2, repressed IRF-1 transactivation. (A) HEK293T cells were transfected with 20 ng TK-renilla control, 200 ng IRF-1 luciferase reporter, 25 ng IRF-1 expression plasmid, and titrating amounts of FLAG-HBZ, FLAG–APH-2, or the control expression vector, as indicated. (Top) At 24 h posttransfection, cell lysates were collected and luciferase levels were measured; for each condition, relative luciferase activity is shown as the mean fold change from the value obtained with IRF-1 expression, which was set at 1. Diagonal striped bar, equivalent FLAG-tagged APH-2 and HBZ (black bar) transfected DNA levels; white bar, similar levels of protein expression. A generalized linear model was used to study the differences between treatments and IRF-1 expression. Dunnett's method was used to control type I error. *, a statistically significant P value of <0.05 compared to the results obtained with IRF-1 expression. (Bottom) Immunoblot analysis was performed to detect the expression levels (FLAG) of HBZ and APH-2 under each condition relative to the expression level of the loading control, β-actin. (B) HEK293T cells were cotransfected with IRF-1 and the empty, S-tagged APH-2, or S-tagged HBZ vector. Cells were treated with 10 μM MG132 for 24 h, and tagged proteins were purified by S-tag-affinity purification at 48 h after transfection. Pulldowns were examined by immunoblot analysis using anti-S-tag and anti-IRF-1 antibodies, as indicated. Five percent of the direct load was used for immunoblot analysis. (C) HEK293T cells were cotransfected with IRF-1 and titrating amounts of FLAG-HBZ, FLAG–APH-2, or the control expression vector, as indicated. Immunoblot analysis was performed 48 h after transfection to compare the levels of transfected FLAG-tagged HBZ, FLAG-tagged APH-2, and IRF-1. β-Actin expression was used as a loading control. The amount of FLAG-tagged HBZ or APH-2, as well as IRF-1, under each condition was measured relative to the amount of β-actin. (D) HEK293T cells were cotransfected with IRF-1 and the FLAG-HBZ, FLAG–APH-2, or control expression vector. After 24 h, cells were treated with 10 μM MG132 for 24 h. Whole-cell lysates were used for DNA affinity precipitation assays. Oligonucleotides that were biotinylated at the 5′ end and that contained a nonspecific sequence (ns) or an IRF-E sequence (6×IRF), as well as nonbiotinylated oligonucleotides (Empty), were used. The complexes pulled down were eluted and analyzed by immunoblotting using IRF-1, FLAG, and β-actin antibodies. The amount of IRF-1 in the direct load was measured relative to the amount of β-actin. The total amount of IRF-1 bound to DNA in the pulldown was also measured.

