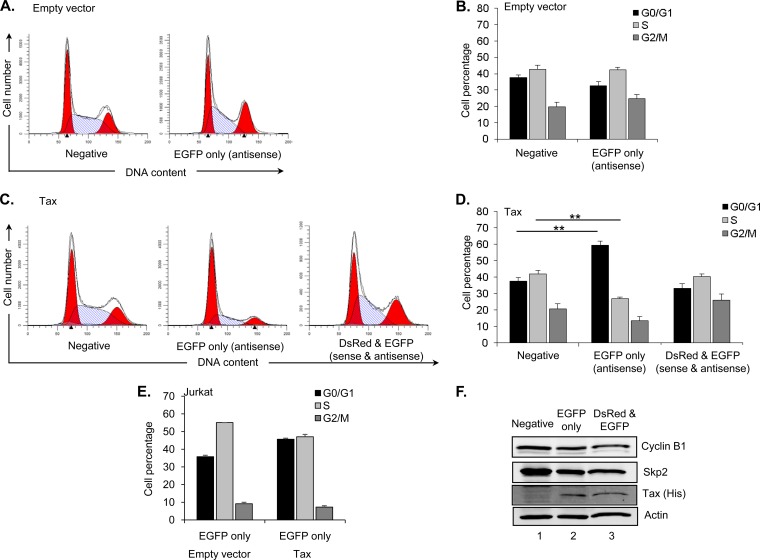
FIG 6.
Cells arrested in G0/G1 phase are unresponsive to Tax-mediated activation of sense transcription. (A) Histograms show the cell cycle distribution of the fluorescence-negative and EGFP-only (antisense transcription) populations from HEK293T cells cotransfected with pHTLV-DsRed-AsEGFP-HTLV and pcDNA3.1 from one representative experiment of four independent experiments. Solid red peaks denote G0/G1 and G2/M phases. Hatched blue areas denote S phase. (B) The graph shows mean percentages of cells in G0/G1, S, or G2/M phase from the fluorescence-negative and EGFP populations for the four independent experiments. Error bars denote standard deviations. (C) Histograms show the cell cycle distribution of the fluorescence-negative, EGFP-only (antisense transcription), and DsRed/EGFP (both sense and antisense transcription) populations from HEK293T cells cotransfected with the reporter construct and pSG-Tax from one representative experiment of four independent experiments. (D) The graph shows mean percentages of cells in G0/G1, S, or G2/M phase from the different populations for the four independent experiments. Error bars denote standard deviations. Significant results as determined by Student's t test are indicated (**, P < 0.001). (E) The graph shows mean percentages of cells in G0/G1, S, or G2/M phase from the different populations for two independent experiments with Jurkat cells. (F) The Western blot shows cyclin B1, Skp2, Tax, and actin expression in HEK293T cells transfected with the reporter construct and pSG-Tax-His. Cells were sorted as a function of fluorescence.

