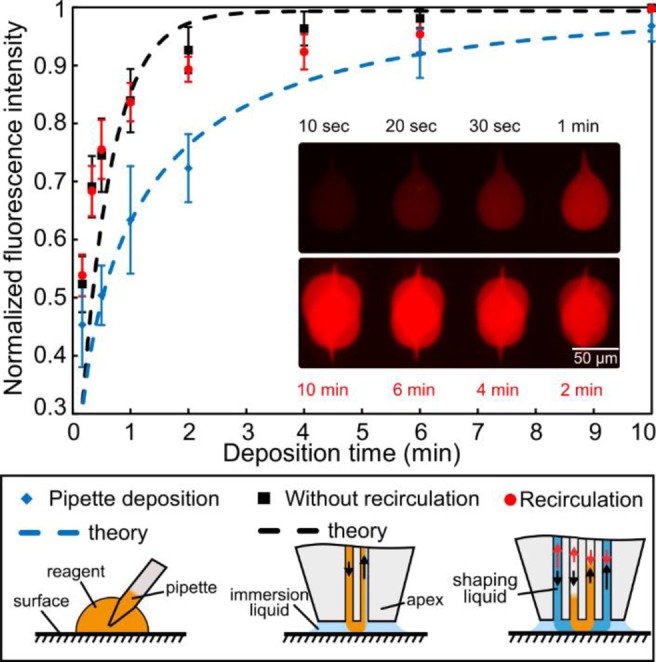
Figure 5.

Deposition of goat anti-IgG on IgG-coated polystyrene surface. Normalized fluorescence intensity of deposited anti-IgG (n = 5) and corresponding trends from the analytical model (theory). Error bars represent the standard deviation for five experiments. The fluorescence intensity is measured in the center (5 μm × 5 μm) of the teardrop-shaped HFC footprint.
