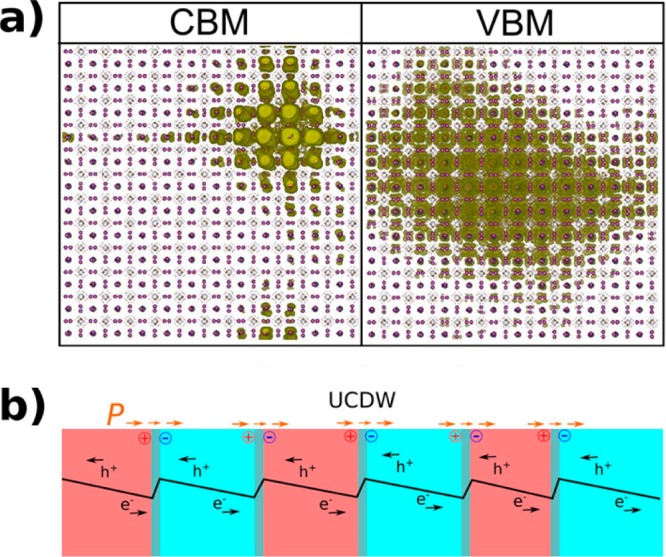
Figure 3.

(a) Isosurface representation of the charge densities associated with the conduction band minimum (CBM) and valence band maximum (VBM) in a 20736-atom supercell of MAPbI3 with MA randomly oriented along the eight ⟨111⟩ directions.58 Reproduced with permission from ref (58). Copyright 2015 American Chemical Society. (b) Schematic illustration of steps in the electrostatic potential, causing electron–hole separations in an array of uncharged domain walls (UCDWs).54 Reproduced with permission from ref (54). Copyright 2015 American Chemical Society.
