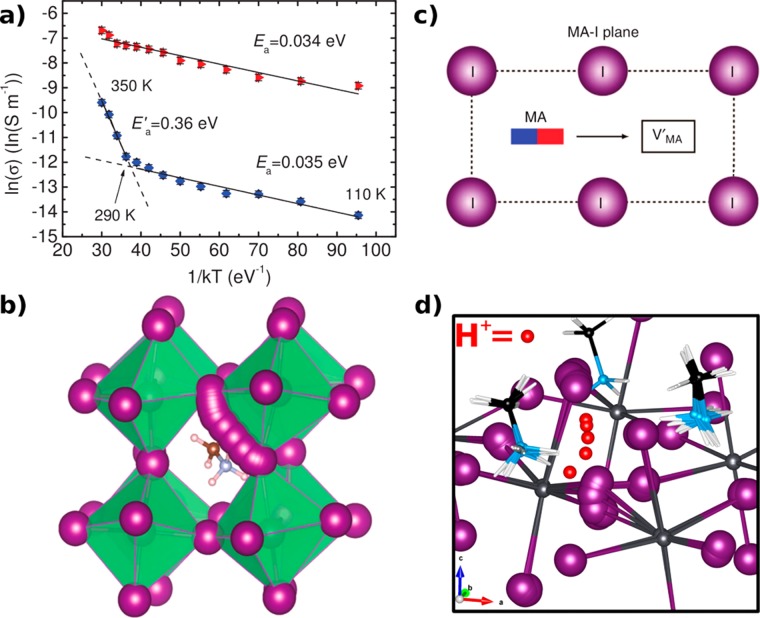
Figure 4.
(a) Arrhenius plot of the electrical conductivity of MAPbI3 in the dark (blue) and under illumination (red).77 Reproduced with permission from ref (77). Copyright 2015 Wiley-VCH Verlag GmbH & Co. (b–d) Schematics of ionic diffusion mechanisms in MAPbI3: migration of I vacancies (b),78 MA vacancies (c),78 and hydrogen interstitials (d).83 Panels (b) and (d) show pathways with several geometries. Reproduced with permission from ref (78). Copyright 2015 Macmillan Publishers Ltd.: Nature Communications. Adapted from ref (83). Copyright 2015 Wiley-VCH Verlag GmbH & Co.

