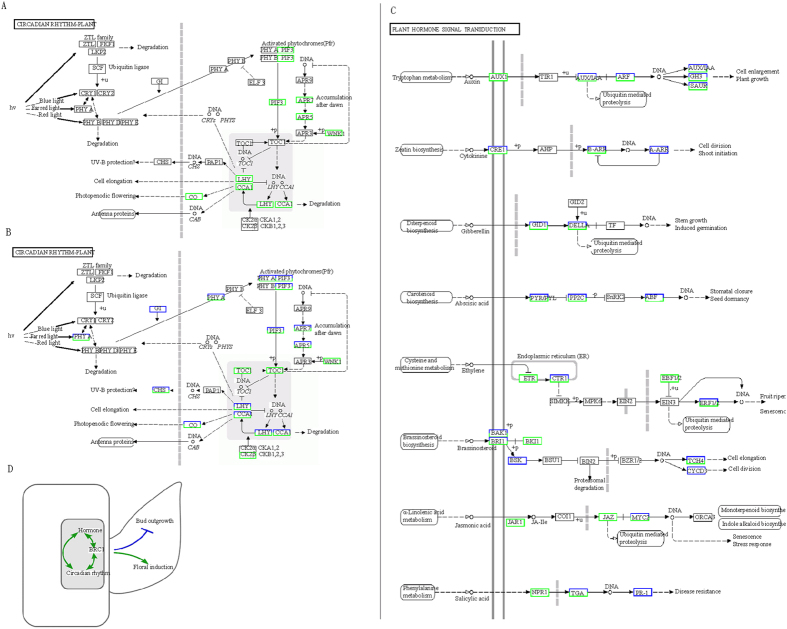
Figure 10. Schematic diagram in KEGG pathway of DEGs in square initiating stage by RNA-Seq data analysis and the model of bud outgrowth.
(A) and (B) DEGs enriched in circadian rhythm pathway of G. hirsutum and G.barbadense, respectively. (C) DEGs enriched of plant hormone signal transduction pathway in G.barbadense. Up-regulated genes are colored red, down-regulated genes are colored green. (D) Proposed model for cotton fruit branch.

