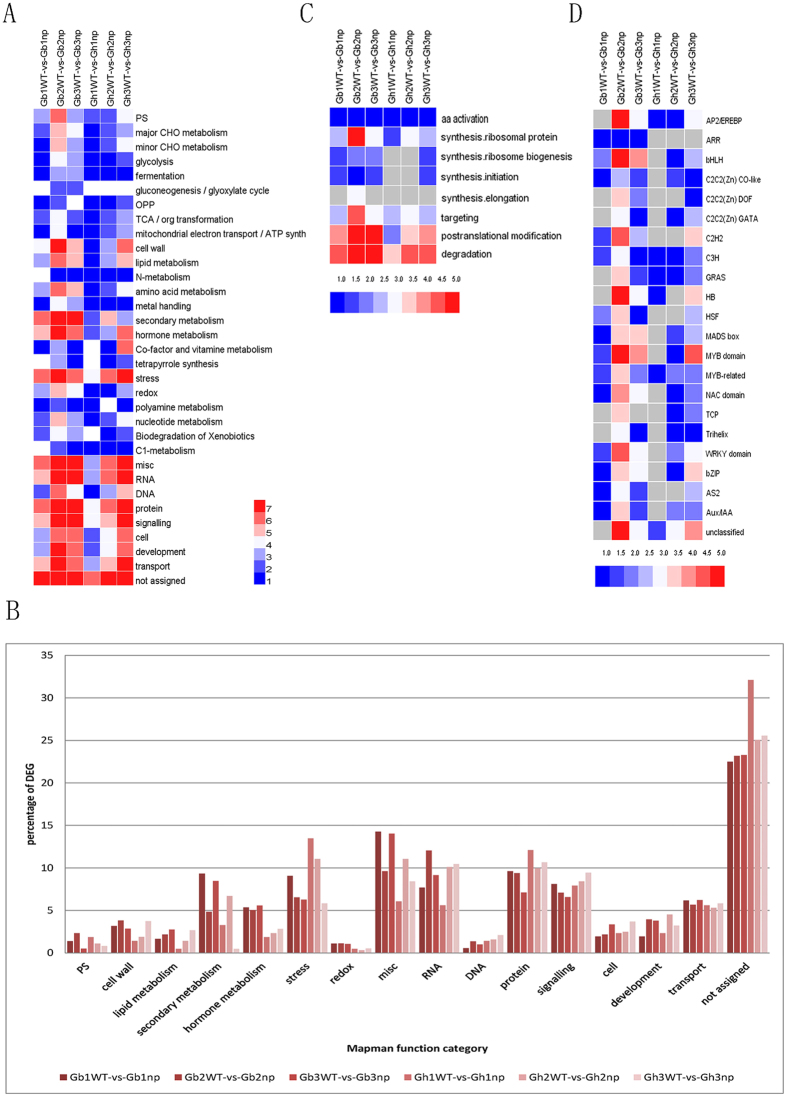
Figure 3. Enrichment of functional categories for DEGs in six compared groups.
(A) Enrichment of functional categories for DEG lists. (B) Enrichment of protein subcategories. (C) Enrichment of transcription factor subcategories. (D) the percentage of each functional categories for DEGs in six compared groups. Gray, not significantly enriched. The bar showed the log2 value of enrich gene number.

