
Figure 9. The statistics of differentially expressed miRNA.
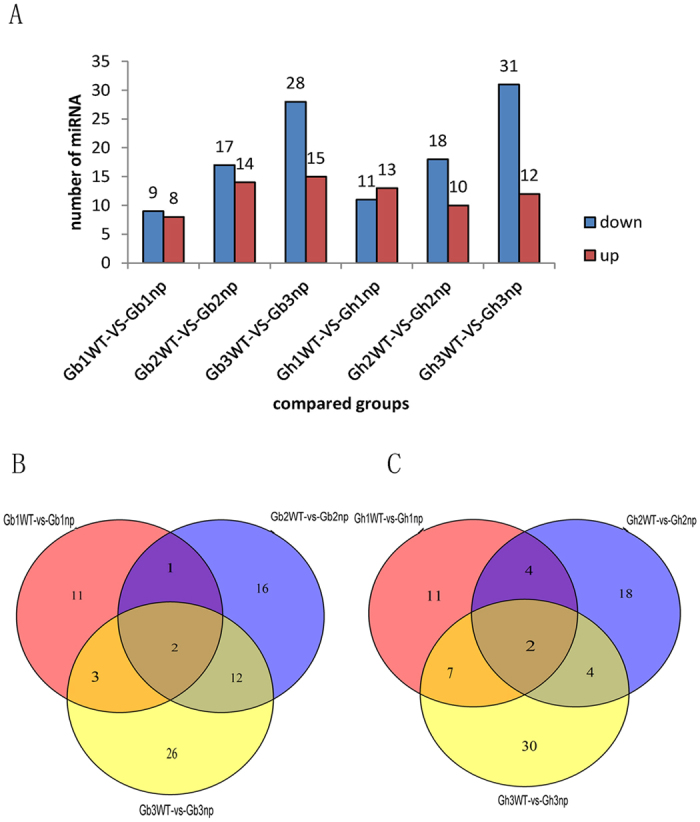
(A) Numbers of different expressed miRNA in each comparison. The numbers on column showed quantity of up-regulated (red) and down-regulated (blue) genes. Venn diagram analyses of stage-specific expression miRNAs in G.barbadense (B) G. hirsutum (C).