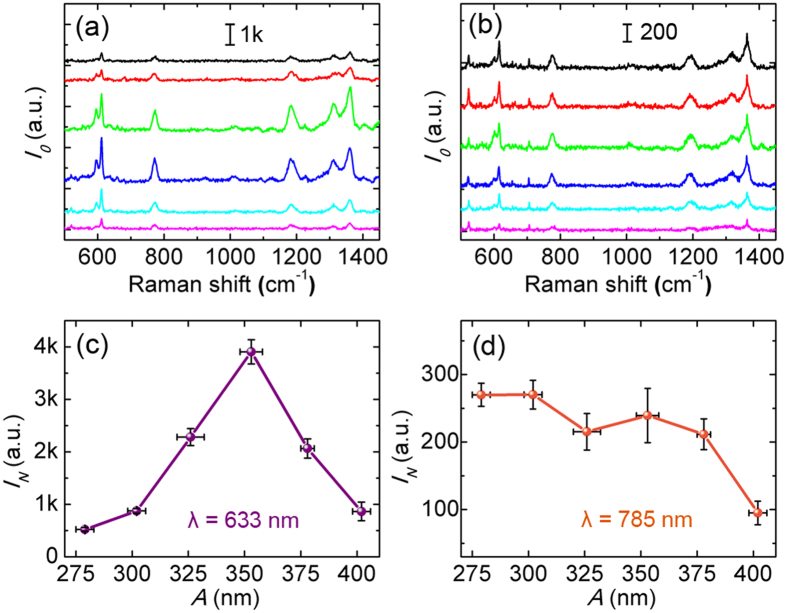
Figure 3. SERS characterization and normalization.
(a,b) Typical SERS spectra with baseline subtracted of R6G (10−6 M) excited at 633 nm (left) and 785 nm (right). The color legend is the same as in Fig. 2e. (c,d) Normalized SERS intensity IN of 612 cm−1 band. Error bars represent the standard deviation of A and the uncertainty of normalized SERS intensity.

