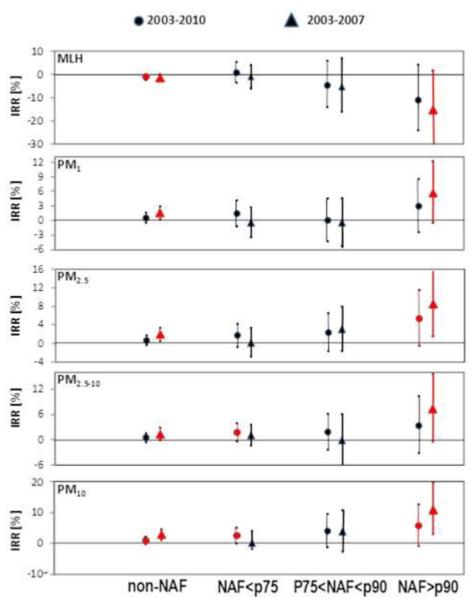
Figure 3.
Periods 2003-2010 (circles on the left) and 2003-2007 (triangles on the right): IRR (%) for increases by interquartile ranges (IQR) of MLH and particulate matter (PM) fractions, and its 95% confidence interval (95% CI), for the association with all cause daily mortality during non-NAF days and during NAF days. These latter estimated as contribution of natural dust to PM10 concentrations lower than the percentile 75 (NAF<p75; 15 μgm−3), between the 75th percentiles and the 90th percentile (p75<NAF<p90; 15-28 μgm−3) and higher than the 90th percentile (NAF>p90; >28 μgm−3). Red colour highlights statistically significant associations.

