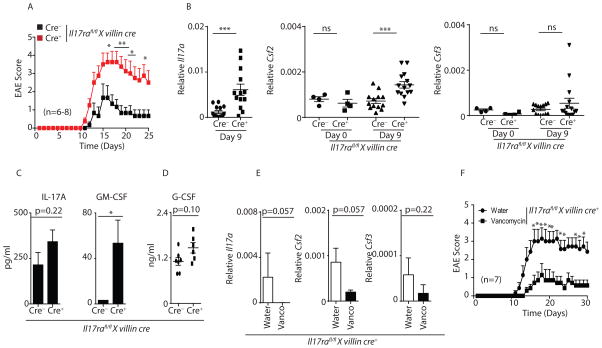
Figure 7. Il17rafl/fl x villin cre+ mice demonstrate enhanced EAE disease severity.
(A) Data shown are EAE onset, peak and severity score in Il17rafl/fl x villin cre+ (n=8) mice and littermate control cre− (n=6) mice.
(B) Terminal ileum of Il17rafl/fl x villin cre+ (n=12) and littermate control cre− (n=13) mice were isolated on day 9 post MOG immunization as well as from unimmunized mice (n=4), and analyzed for the expression of Il17a, Csf2 and Csf3 by qPCR.
(C) Il17rafl/fl x villin cre+ (n=7) and littermate cre− (n=7) control mice serum were isolated on day 9 post MOG immunization. IL-17A and GM-CSF concentrations were determined in the serum by Luminex assay.
(D) Data shown are G-CSF concentration in the serum of Il17rafl/fl x villin cre+ (n=7) and littermate cre− control mice (n=7) on day 9 post EAE.
(E) Terminal ileum of control water (n=7) or vancomycin (n=7) treated MOG-immunized Il17rafl/fl x villin cre+ mice (on day 9 post MOG immunization) were analyzed for the expression of Il17a, Csf2 and Csf3 by qPCR.
(F) Data shown are EAE onset, peak and severity score in control water (n=7) or vancomycin (n=7) treated MOG-immunized Il17rafl/fl x villin cre+ mice.
Figures 7A, 7C, 7D and 7F were generated from 2 independent experiments. Figure 7B was generated from 3 independent experiments. Data presented as mean ± SEM on relevant figures. *P ≤ 0.05; **P ≤ 0.01; ***P ≤ 0.005 (Mann-Whitney test, Two-tailed). See also Figure S7.

