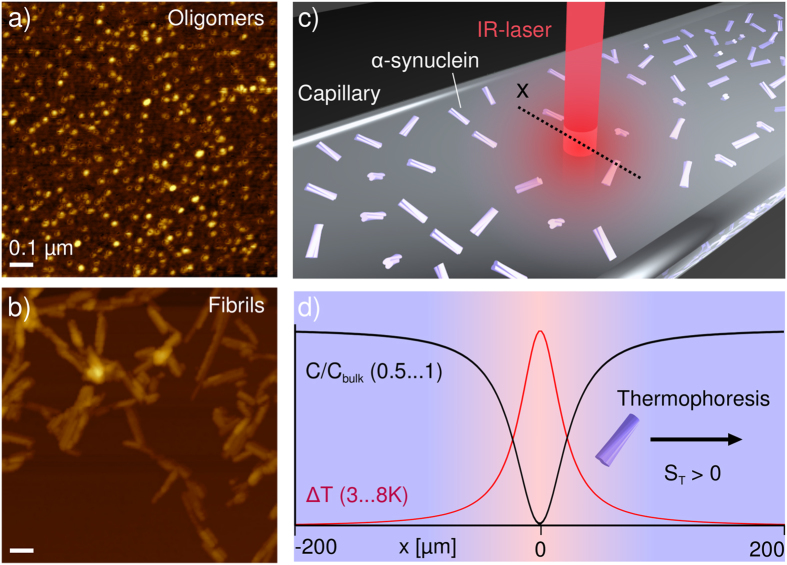
Figure 1. Quantitative thermophoresis of proteins.
AFM images of oligomeric (a) and fibrillar (b) forms of the protein α-synuclein, associated with Parkinson’s disease. The oligomers have an average diameter of 15 nm in solution, as determined by fluorescence correlation spectroscopy. (c) An initially homogeneous solution, or a suspension of a protein species, here illustrated with fibrillar aggregates, is subjected to localized heating by an IR-laser inside a borosilicate capillary, which leads to directed movement of molecules and complexes along the temperature gradient, until a steady state is established. (d) The radially averaged temperature profile (typically established within less than a second after turning on the laser), and the concentration profile (usually established within seconds to minutes) are illustrated schematically at steady state. A schematic fibril is displayed undergoing positive thermophoresis, i.e. migrating away from the heated spot.

