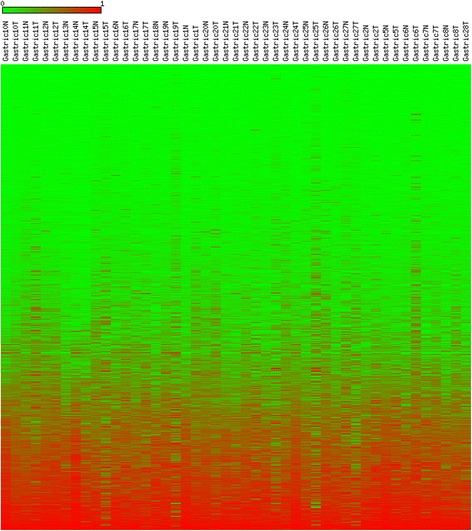
Fig. 2.

A heatmap presentation of the DNA methylation levels of the entire dataset of 27564 CpG sites in 24 tumor and normal gastric cancer tissue pairs. A value of 0.00 (most green) indicates fully unmethylated, whereas a value of 1.00 (most red) indicates entirely methylated locus. The figure demonstrates that the majority of CpG sites in the dataset, including both tumor and normal tissue, showed low levels of DNA methylation
