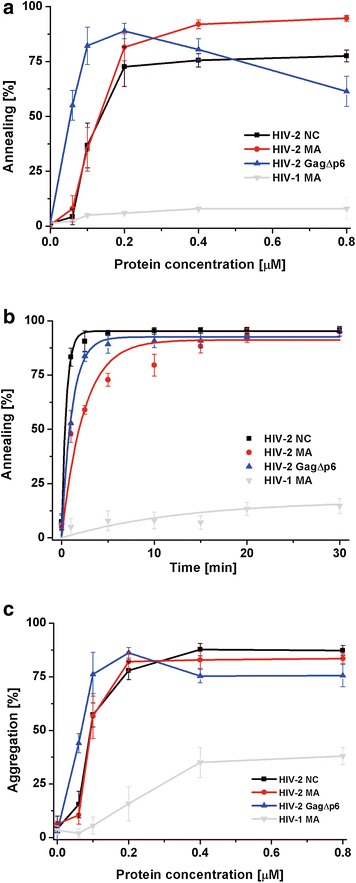
Fig. 3.

Comparison of HIV-2 GagΔp6, MA, NC and HIV-1 MA nucleic acid chaperone activity. a TAR annealing assays in the presence of increasing concentrations of protein. b Time course TAR annealing assays using 0.2 µM of each protein (1 protein per 3.9 nt). The curves are single-exponential fits to average data. Representative gels are included in Additional file 2. c TAR(−) DNA aggregation by the different proteins
