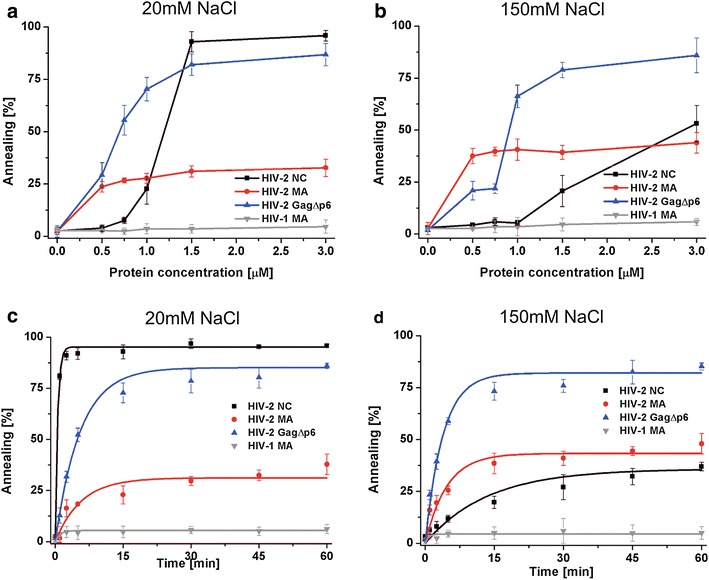
Fig. 4.

Protein induced tRNALys3 annealing in the presence of varying NaCl concentrations. a and b Concentration course annealing assays. c and d Time course annealing assays using 1.5 µM of each protein (1 protein per 3.9 nt), the curves are single-exponential fits to average data. Representative gels are included in Additional file 2
