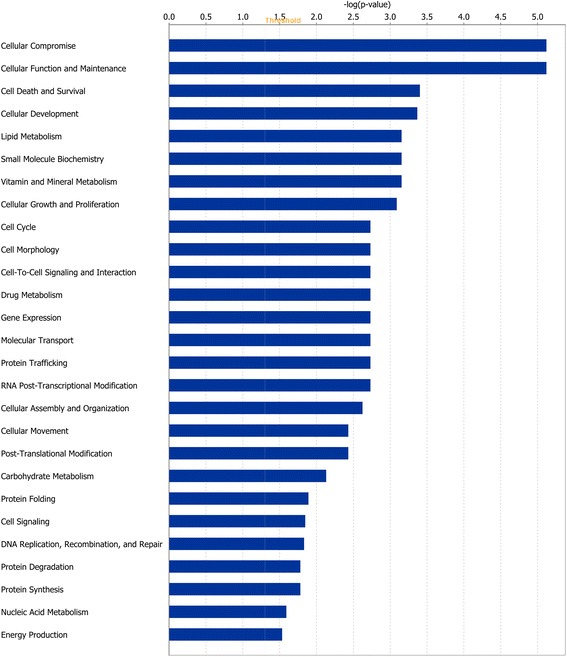
Fig. 5.

Classification of differentially expressed genes according to molecular and cellular function, most significantly affected by re-alimentation in Period 2. The bars indicate the likelihood [−log (P value)] that the specific molecular and cellular function was affected by re-alimentation compared with others represented in the list of differentially expressed genes
