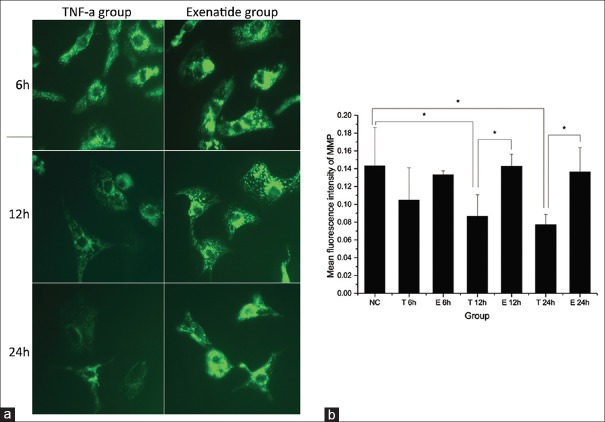
Figure 5.
Measurement of mitochondrial membrane potential. (a) Representative fluorescence images (original magnification ×600) of mitochondrial membrane potential of different groups at different time points detected by rhodamine-123; (b) the bar graph shows the mean fluorescence intensity of mitochondrial membrane potential of each group. *Adjusted-P < 0.05; NC: Control group, T: Tumor necrosis factor-α group, and E: Exenatide group.

