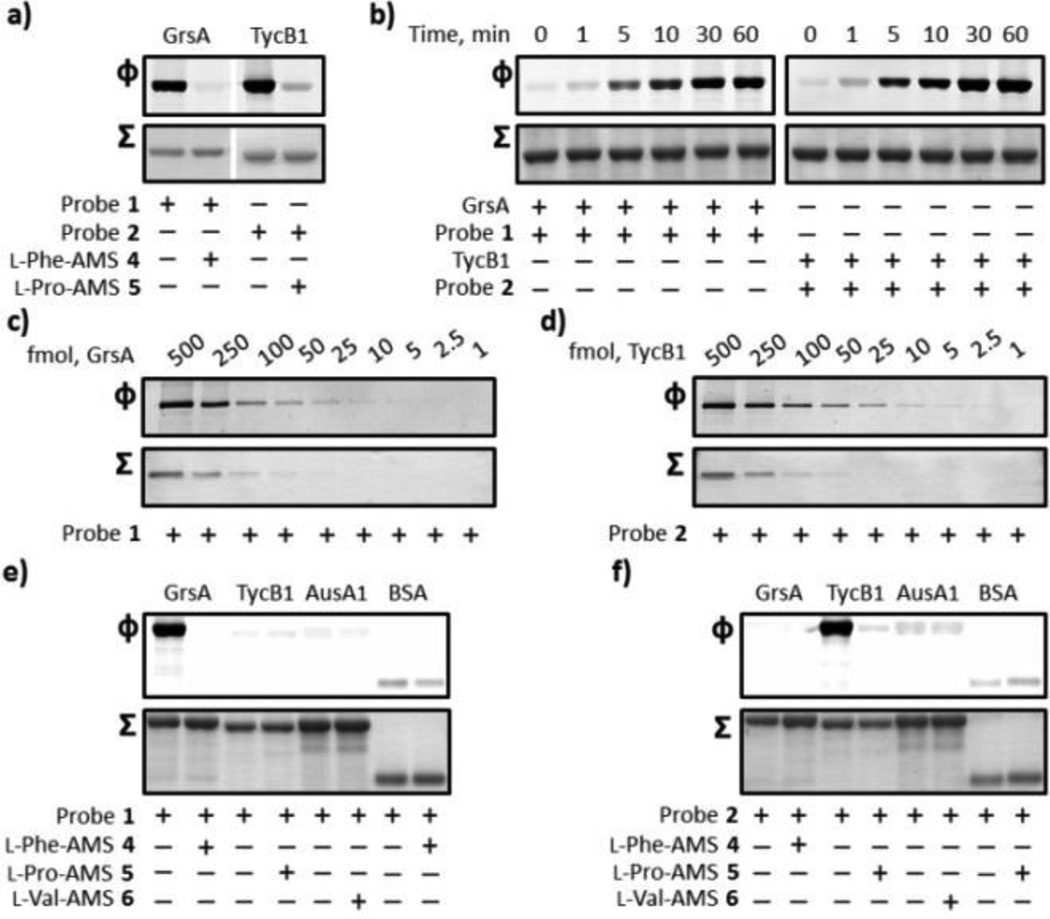
Figure 3.
Labeling of recombinant holo-GrsA and holo-TycB1 with probes 1 and 2. (a) Labeling of GrsA and TycB1 and competitive inhibition studies with excess inhibitors 4 and 5. GrsA (1 µM) and TycB1 (1 µM) were individually pre-incubated in either the absence or presence of 100 µM of inhibitors 4 and 5 and treated with 1 µM of the individual probes 1 and 2. (b) Ultraviolet photolysis time course studies of the labeling of GrsA with probe 1 (left) and TycB1 with probe 2 (right). SDS-PAGE analysis denoting the labeling of 1 µM of GrsA and TycB1 with 1 µM probes 1 and 2, respectively. (c, d) Limit of detection of GrsA and TycB1 labeling. GrsA (0.125–62.5 nM) and TycB1 (0.125–62.5 nM) were individually incubated with probes 1 and 2. (e, f) Labeling specificity of probes 1 and 2. GrsA (1 µM), TycB1 (1 µM), AusA1 (1 µM), and BSA (1 µM) were individually treated with 1 µM of probes 1 and 2 in either the absence or presence of 100 µM of the inhibitors 4, 5, and 6. For each panel, Φ depicts the fluorescence observed with λex = 532 nm and λem = 580 nm, and Σ displays the total protein content by staining with Coomassie Blue (a, b, e, and f) or a silver staining method (c and d). Full gels (Figures S3) and experimental procedures are provided in the SI.

