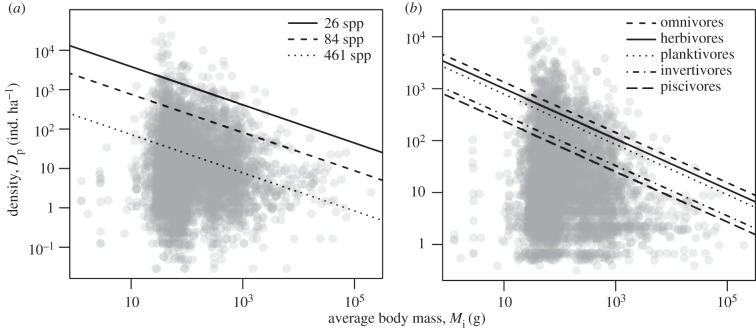
Figure 2.
Relationship of standardized population density to body mass (grey circles), along with predicted effects (lines) at the highest density quantile (q = 0.95) for (a) species richness and (b) trophic groups. Population density values have been standardized differently in (a,b) to graphically depict partial effects of variables of interest after accounting for temperature (standardized to median temperature in a and b), sampling area (standardized to median area in a and b), trophic group (standardized in a), and species richness (standardized to median species richness in b) (see Methods for median values). Average size-corrected body mass, Mp, has been transformed ( ) into body mass units (g) for plotting.

