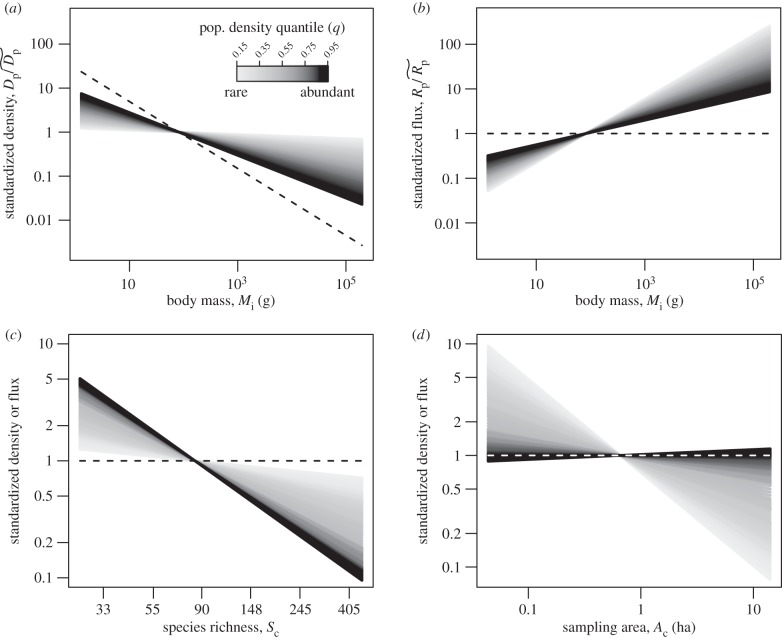
Figure 3.
Estimated effects of (a,b) size-corrected body mass, (c) species richness, and (d) sampling area on population density (equation (2.5)) and energy flux (electronic supplementary material, equation S1). Dashed lines (black in a–c, white in d) represent expectations based on the assumption of energetic equivalence. Grey-scale lines represent predictions of quantile regression models fitted to different population density quantiles, q, that encompass rare (light grey, q = 0.15) to abundant species (black, q = 0.95) (see figure 1 for parameter estimates of quantile regression models at different q-values). Population densities, Dp (equation (2.5)), and fluxes, Rp (electronic supplementary material, equation S1), have been standardized as  and
and  respectively. Therefore, the y-axes represent n-fold deviations from
  and/or
  both of which were estimated from the quantile regression models based on median values for size-corrected body mass (
 ), temperature kinetics (
 ), community species richness (
 ) and sampling area (
 ) (see Methods). Average size-corrected body mass, Mp, has been transformed (
 ) into body mass units (g) for plotting.

