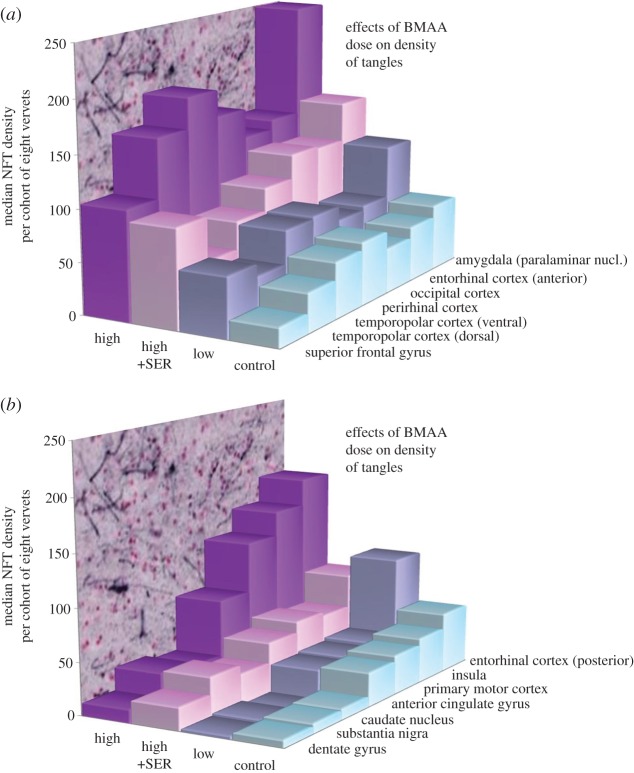
Figure 3.
Median counts for density of AT8 IHC positive staining inclusions plus NFT per brain area by treatment type. Each horizontal surface represents the median of an eight-vervet cohort statistically significant for dose using the Jonckheere–Terpstra trend test. (a) Brain regions in which AT8 IHC positive density counts from the 210 mg kg−1 d−1 BMAA treatment are greatest compared with other treatment types. (b) Brain regions in which AT8 IHC positive density counts from the 210 mg kg−1 d−1 BMAA plus 210 mg kg−1d−1 l-serine (high+SER) treatment is less than low-dose (low) BMAA (entorhinal cortex posterior) or in which low-dose NFT density is similar to controls (all other brain areas).

