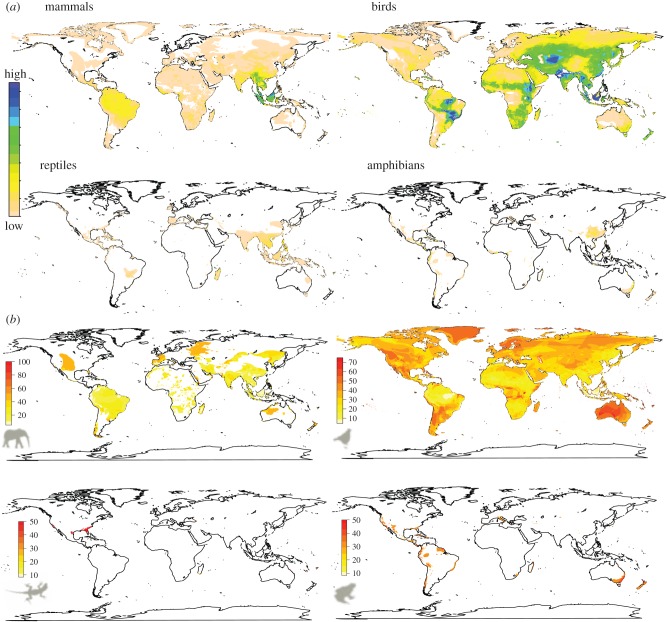
Figure 1.
Spatial distribution of IAS-threatened (CR, EN and VU IUCN Red List) mammals, birds, reptiles and amphibians, in absolute number (a) and given as a proportion of all threatened species (b). For instance, a proportion of 50% for a given location means that 50% of the threatened species there are threatened by IAS.

