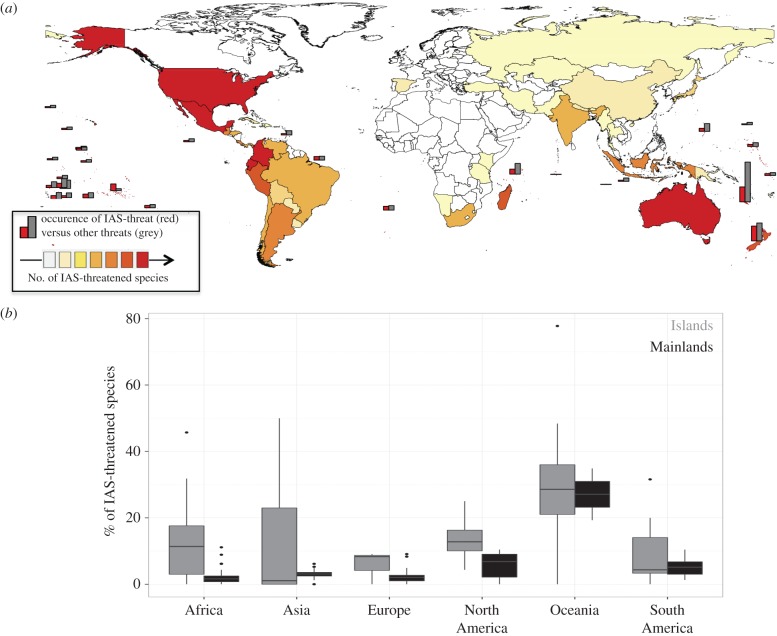
Figure 2.
(a) Maps of the distribution of CR, EN and VU IAS-threatened vertebrates per country, and occurrences of IAS-threat (red) versus other threats (grey). Note that only countries and islands are illustrated here where more than 25% of the threatened species are threatened due to IAS. (b) Boxplots showing the percentages of IAS-threatened species compared to all threatened species on islands versus mainlands.

