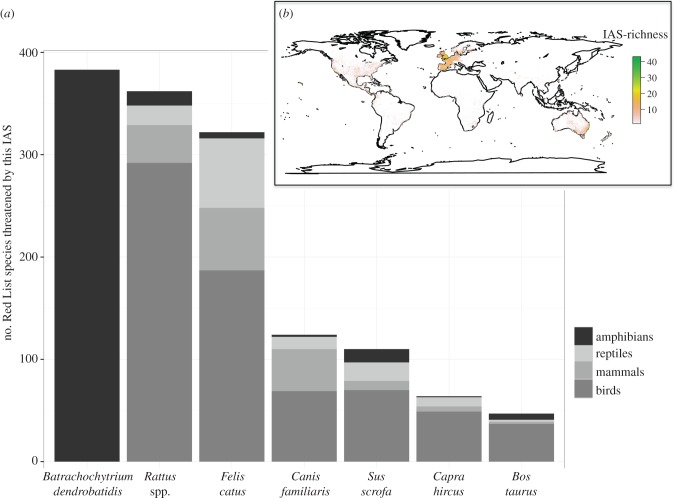
Figure 4.
(a) Top 7 of IAS that globally threaten the highest numbers of mammals, birds, reptiles and amphibians. (b) Spatial distribution of IAS that have been identified as threatening vertebrates and for which spatial distribution data were available (N = 197). We calculated Pearson's correlation coefficient between IAS distribution (here) and IAS-threatened vertebrates (combined figure of figure 1b): Pearson's r = −0.05.

