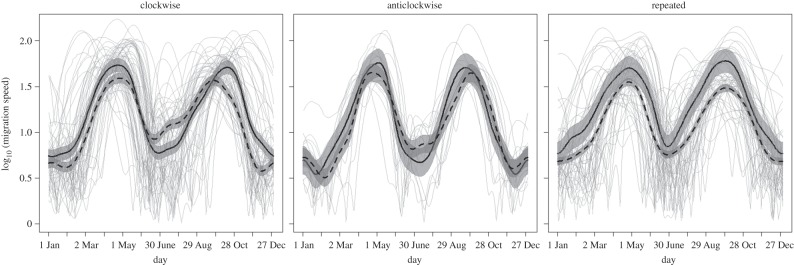
Figure 2.
Migration speeds for 118 bird species within the Western Hemisphere for the combined period 2002–2014 summarized within six migration categories. The grey lines are the migration speeds estimated for individual species, and the fitted lines and 95% confidence bands are from generalized additive mixed models with species as a random effect. The solid fitted lines are transoceanic migrants (n = 39, 7, and 15, respectively). The dashed fitted lines are terrestrial migrants (n = 14, 7, and 36, respectively).

