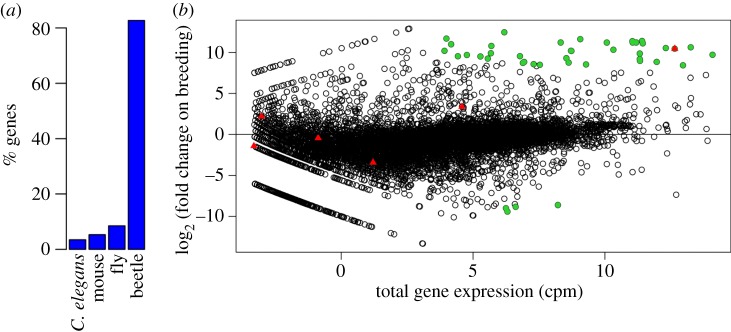
Figure 1.
The transcriptome of N. vespilloides. (a) The percentage of peptides whose most similar sequence was in the genome of the mouse M. musculus, the nematode C. elegans, the fly D. melanogaster or the beetle T. castaneum. A single isoform of each gene in the differential expression analysis is included. (b) Total gene expression (counts per million) and log2 (fold change) in gene expression in the guts of breeding versus non-breeding females. Lysozymes are shown in red triangles. The most significantly differentially expressed genes (p < 10−20, Bonferroni corrected p < 8.4 × 10⁻¹⁷) are in green circles. (Online version in colour.)

