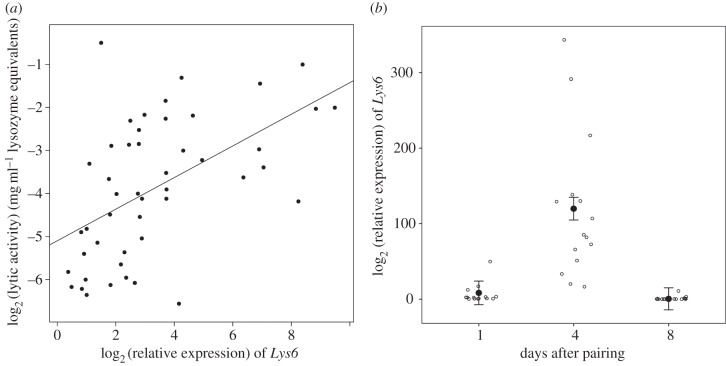
Figure 3.
Relationship between Lys6 expression and the phenotype. (a) The correlation of Lys6 expression and lytic activity in beetle anal exudates (N = 47). Expression was measured by quantitative PCR relative to Actin5C. Lytic activity of exudates was measured in a lytic zone assay relative to known concentrations of hen egg white lysozyme. The values plotted correspond in both axes to the mean of two technical replicates. (b) Change of Lys6 expression throughout the breeding bout. Expression of Lys6 was significantly higher on day 4 than on day 1 (post hoc Tukey comparison: estimated difference = 111.47, p < 0.0001) and day 8 (post hoc Tukey comparison: estimated difference = 119.38, p < 0.0001). Bonferroni correcting these p-values for the six genes investigated yields p < 0.001 in all cases. Black circles show least-squares means of a linear mixed model with standard error bars. White circles show data points corresponding to each day, jittered to avoid overlap.

