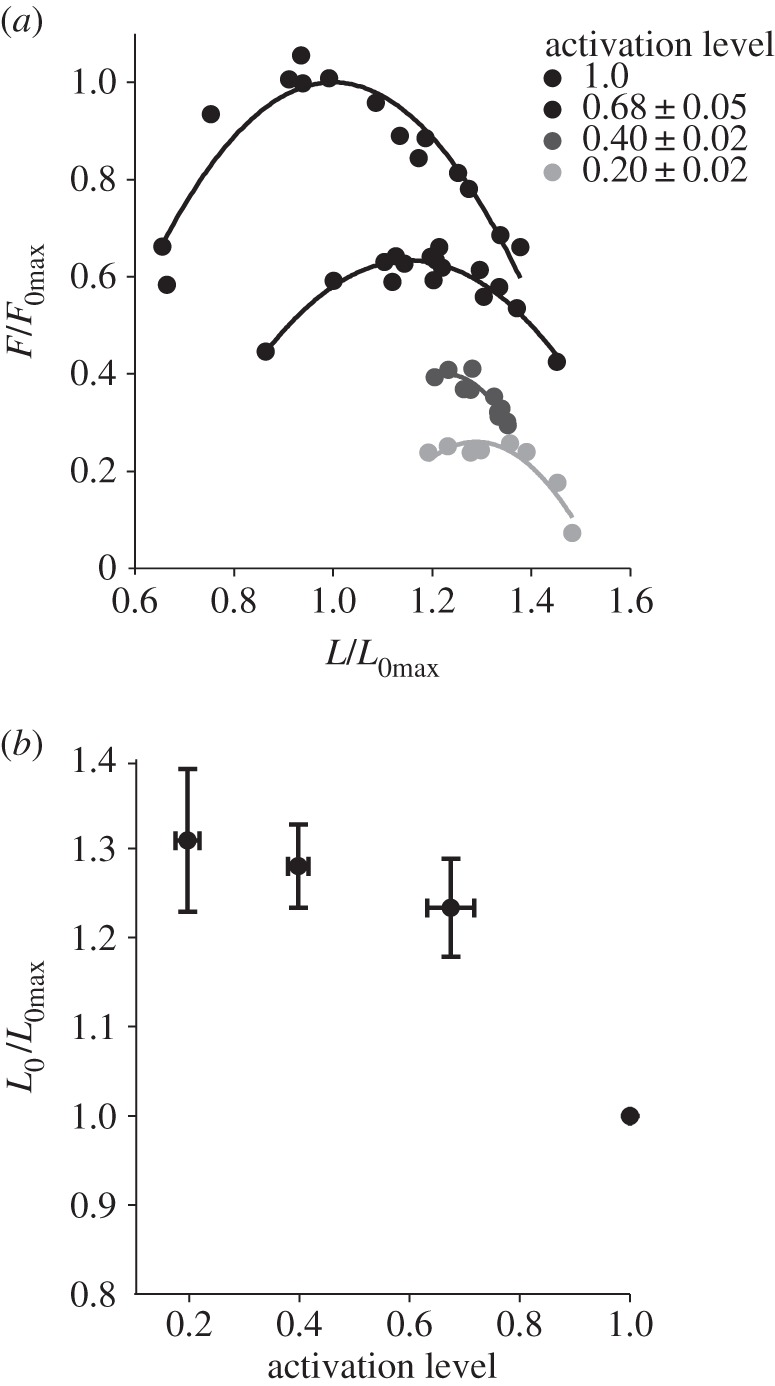
Figure 1.

The effect of activation level, on the force–length relationship. Sample force–length curves at all relative force levels are shown (a). From these relationships, optimum length (L0/L0max) and activation level (F0/F0max) were determined for each stimulus condition (b). There was a significant effect of activation level (F0/F0max) on optimum length (p < 0.01) (b). n = 11, 6, 7 and 4.
