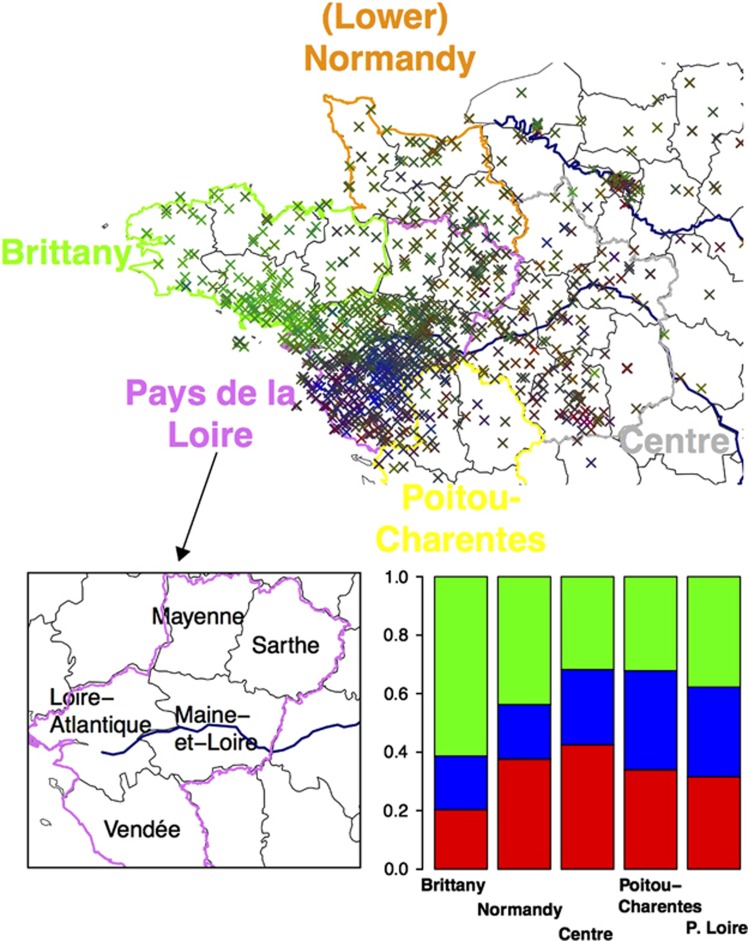
Figure 1.
Ancestry coefficients displayed using the RGB color model. To visualize the admixture coefficient, each individual is colored using a RGB (red–green–blue) coding scheme. The RGB coefficients are proportional to the ancestry coefficients obtained with admixture. Departments of the Pays de la Loire region (bottom left). Admixture coefficients for the different regions of WF. Following the same RGB coding scheme, this figures shows the variation of admixture coefficients in WF (bottom right).

